This Statistical Bulletin releases new estimates of gross annual incomes of full-time employees (i.e. wages) for the 2022/23 financial year, with comparable estimates for previous years from 2013/14 onwards. To download a PDF version of this Bulletin, please click here.
These estimates measure gross before-tax incomes of persons in regular full-time employment on St Helena, reported through the Pay-As-You-Earn tax collection system. They exclude company and self-employment incomes, incomes of Technical Cooperation (TC) Officers of the St Helena Government, investment income, Income Related Benefits, incomes from pensions (including the Basic Island Pension), and part-time and part-year incomes, all as far as they can be identified in the dataset. All annual estimates are rounded to the nearest £10.
Median wage levels, adjusted for inflation
The median annual wage on St Helena in 2022/23 was an estimated £9,970. When price inflation is taken into account, this is just 0.1% higher than the median wage in 2021/22 (Chart 1).
Chart 1. Annual gross wages from full-time employment: median and upper and lower quartiles, 2013/14 to 2022/23 (inflation-adjusted 2022/23 prices)
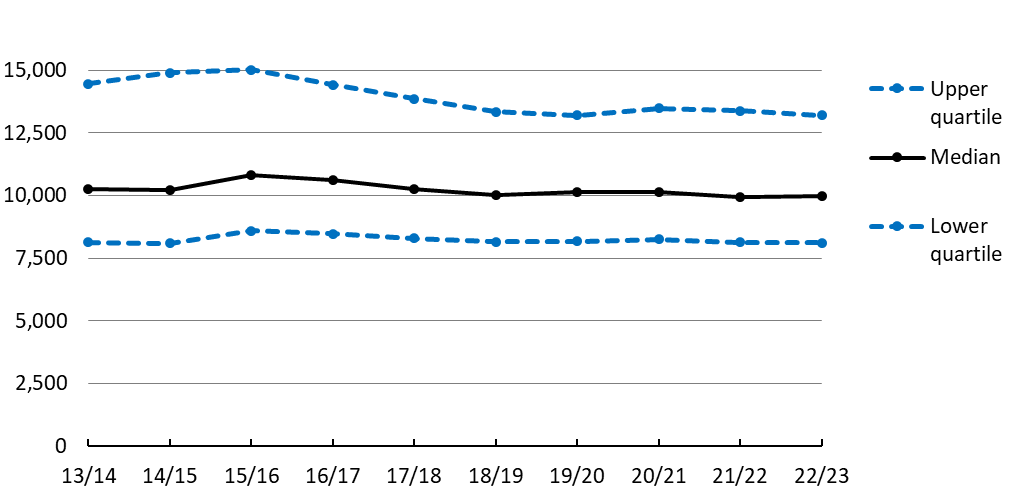
The median is the usual measure of average incomes or wages because it is less sensitive to small numbers of relatively high wage earners in a population than the mean, which is the more common method used in other statistics. A median wage level of £9,970 means that, for 2022/23, half the people earning wages from non-TC employment had gross wages that were less than £9,970 and half had gross wages that were higher.
Wage level range
Chart 1 also shows the upper and lower quartiles; the lower quartile is the point at which a quarter of wages are lower, and the upper quartile is the point at which a quarter of wages are higher; half of all employment wages lie between the lower and upper quartiles. For 2022/23 half of all full-time employees earned between £8,110 and £13,200. The gap between the upper and lower quartiles is still smaller in 2022/23 than in 2014/15 and 2015/16, likely the result of a number of relatively higher paid workers leaving the workforce when St Helena’s Airport was completed.
Differences in wage levels between women and men
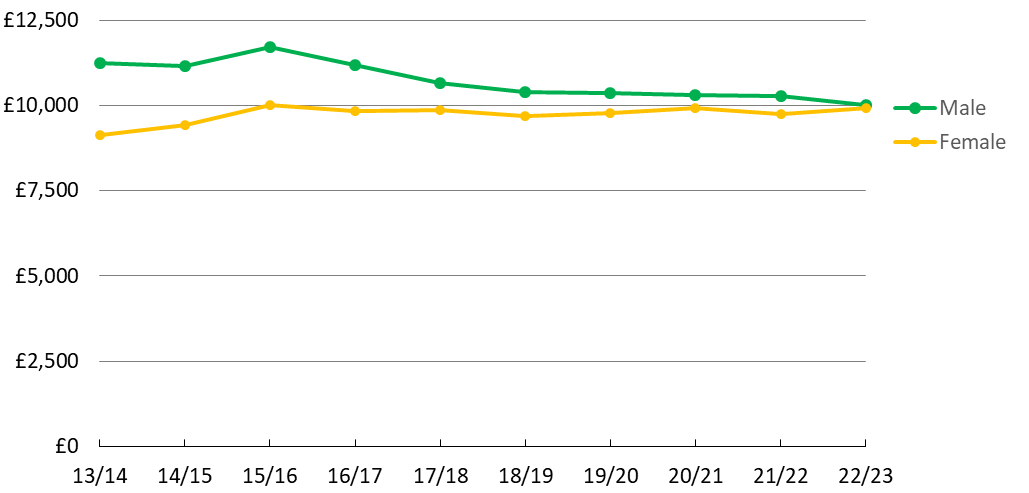
Chart 2 shows inflation-adjusted median wages from employment broken down by male and female employees, between 2013/14 and 2022/23. For every year, the male median wage has been higher than the female median wage, but the gap between the two has narrowed in recent years, and has almost disappeared in 2022/23. In part this is due to the completion of the new Airport; construction workers employed were predominantly male, relatively higher paid, and many of them have since either left St Helena or found alternative lower paid employment.
Chart 2. Median real gross annual wages from employment, male and female 2013/14 to 2022/23, in constant 2022/23 prices (i.e. adjusted for inflation)
Average wage levels by occupation
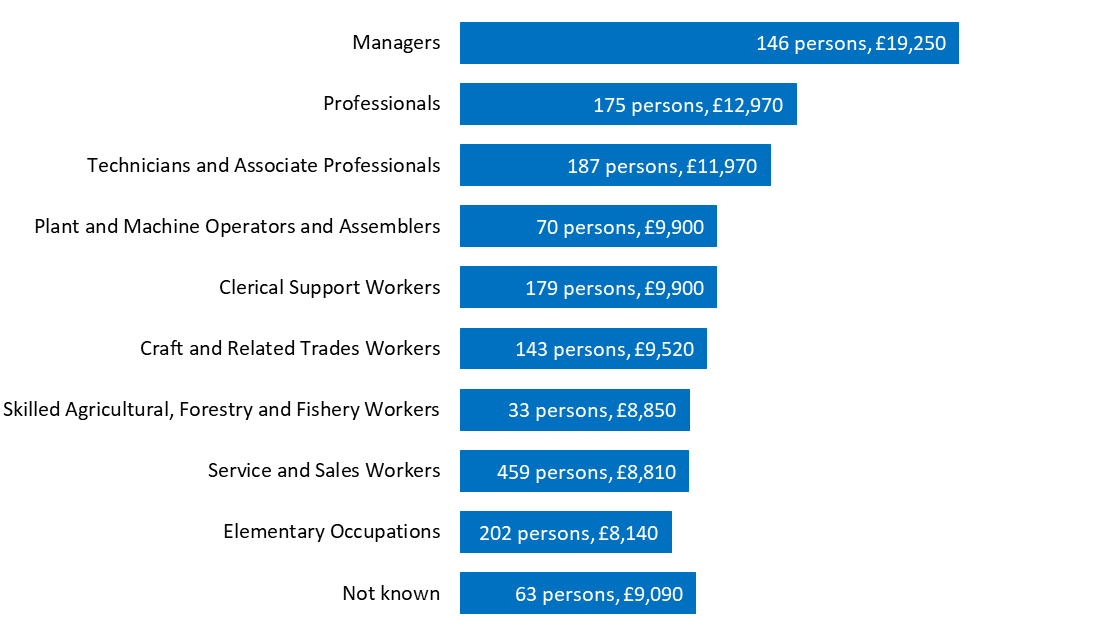
Employees have been classified into their main occupational grouping using the International Standard Classification of Occupations published by the United Nations (International Labour Organisation). Chart 3 shows estimates of median wages in each of these major groupings, for 2022/23, excluding TC Officers.
The groups of occupations with the highest wages, on average, were Managers, Professionals, and Technicians and Associate Professionals. These groups accounted for 508 employees, or 31% of non-TC employees. The occupations with the lowest wages, on average, were Skilled Agricultural, Forestry and Fishery Workers, Services and Sales workers, and Elementary Occupations (this group includes unskilled labourers). These groups accounted for 724 employees, or 44% of non-TC Officers.
Chart 3. Median gross annual wages from employment by occupational grouping, 2022/23
Average wage levels by industry
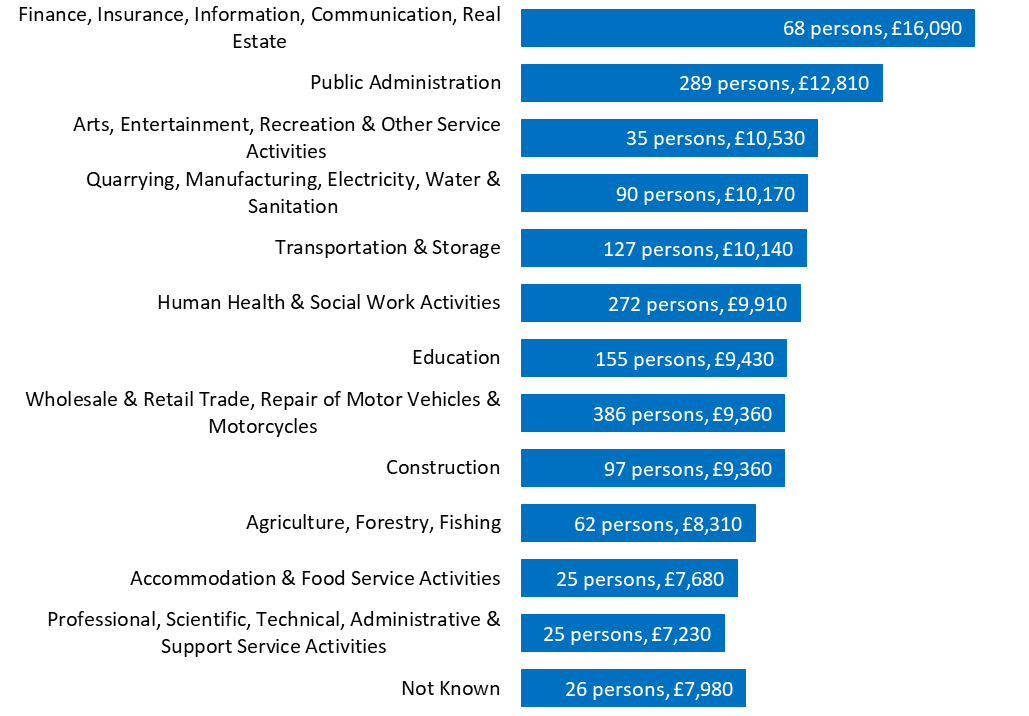
Employees have been classified into their main industry grouping using the International Standard Industrial Classification published by the United Nations. Chart 4 shows estimates of median wages in each major grouping, for non-TC employees.
In 2022/23 the groups of industries with the highest wages, on average, were Finance, Insurance, Information, Communication and Real Estate, and Public Administration. The industries with the lowest wages, on average, were Professional, Scientific, Technical, Administrative and Support Service Activities, and Accommodation and Food Service Activities.
Chart 4. Median gross annual wages from employment by industry, 2022/23
Numbers of persons in full-time employment
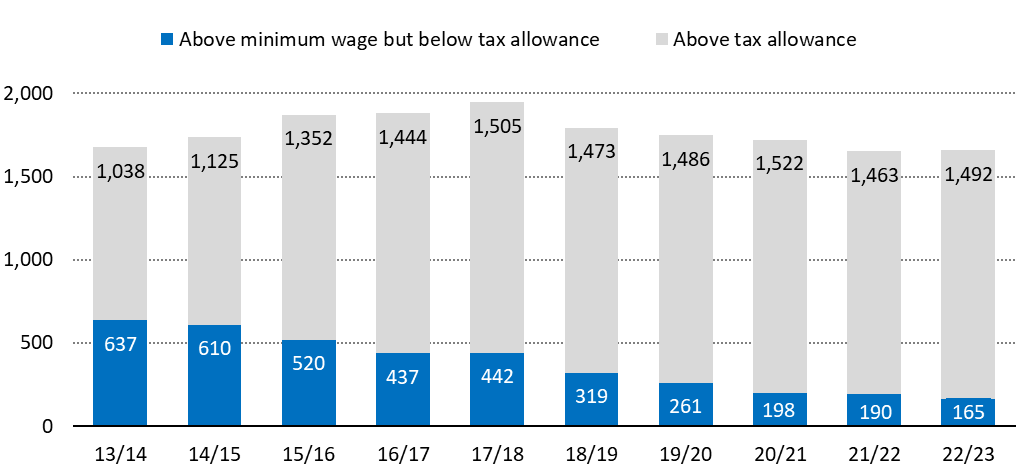
Chart 5 shows the number of persons with wages from full-time employment above and below the income tax allowance, excluding TC officers (personal income below the income tax allowance is not subject to income tax).
The total estimated number of persons with wages from full-time employment rose to 1,947 in 2017/18, the year when the new airport was opened and most construction activities were completed. Since then, the number has tended to fall slightly each year; in 2021/22, there were an estimated 1,653 persons with wages from full-time employment, although in 2022/23 there was a very slight increase, to 1,657.
The number of full-time employees above the income tax allowance of £7,000 also increased in 2022/23, to 1,492, 29 people more than 2021/22, and only 13 people less than the highest number recorded in 2017/18 (1,505). The number of people earning more than the minimum wage but not earning enough to pay income tax fell to 165 in 2022/23.
Chart 5. Number of employees in full-time employment, 2013/14 to 2022/23
Get the data
The complete set of statistics on average gross incomes from employment from 2013/14 to 2022/23 is available here. For more statistical data on the St helena Economy, see here.
Methodology
Data source. Statistics on wages and incomes on St Helena are derived from a computerised database maintained by the Income Tax Office, which captures information about all wage earners whose details are submitted through the Pay-As-You-Earn (PAYE) system. There are some limitations when using this database as a source for estimating incomes; for example, informal income earned may not be declared; it is difficult to distinguish full-time and part-time workers and full-year and part-year incomes; and some reported incomes may include second jobs.
Gross income (wages) from employment. The primary analysis in this Bulletin uses average gross incomes from employment, also referred to as wages. Income from investments (including employer pension schemes) and from self-employment, benefits, or the Basic Island Pension is excluded, as far as they can be identified. Incomes are gross, that is, before any tax is deducted, and all published estimates are rounded to the nearest £10 (calculations of constant price estimates are made on the unrounded estimates and growth rate calculations are made using the rounded estimates). Only incomes that are high enough to represent full-time employment from a 35 hour working week are included.
Median. The median is a measure of the average value of a set of numbers. It is the ‘middle number’ in a ranked list, the value at which exactly half the population has a smaller value and half has a higher value. It is preferred to the mean when estimating average incomes or wages, since it is less easily ‘skewed’ by a few individuals with relatively large incomes.
Mean. The mean is a measure of the average value of a set of numbers; it is derived by adding all the numbers together, and dividing by the number of values in the dataset. While it is the most common measure of the average for many applications, it can produce misleading results for estimating average incomes because it can be biased by small numbers of relatively high incomes.
Adjusting for inflation. Most of the average income estimates are adjusted for the impact of price inflation, using St Helena’s Retail Price Index to estimate relevant statistics in 2022/23 prices. Inflation-adjusted estimates are called ‘constant’ or ‘real’; unadjusted estimates are called ‘nominal’ or ‘current’. Inflation-adjustment makes comparisons over time more meaningful, since any change up or down shows whether a person has more or less purchasing power. For example, the median nominal gross income for 2013/14 was £7,890 per year. But prices were not the same in 2022/23 as they were in 2013/14; an employee would need to have earned £10,270 a year to buy the same amount of goods and services in 2022/23 that they could buy in 2013/14 with £7,890. So £10,270 is the average gross income in 2013/14 stated in 2022/23 prices.
Eliminating part-year and part-time incomes. A lower bound threshold is set to try to ensure that part-time or under-reported incomes are excluded from the analysis as far as possible; the threshold is set using the Minimum Wage for a 35 hour week. Incomes that were assessed for income tax using an allowance of half a year or less have also been excluded.
Exclusion of Technical Cooperation Officers from the analysis. Technical Cooperation Officers are persons employed by St Helena Government following international recruitment as a result of limited labour availability in particular occupations on the Island; in 2022/23, 92% of them were Managers, Professionals or Associate Professionals, or Technicians, and 97% of them worked in Public Administration, Human Health and Social Work, or Education. They are employed for a fixed period of time on internationally competitive pay scales and terms and conditions which differ from those recruited locally on St Helena. As such, their incomes are not typical and so are excluded from the main statistics on incomes.
Contact us and find out more
The team at the Statistics Office currently comprises Neil Fantom, Statistical Commissioner, Kelly Clingham and Justine Joshua, Senior Statistical Assistants, and Courtney O’Dean, Statistics Assistant. Please visit us in person; the Statistics Office is on the second floor of the Post Office, Jamestown. Call by, we would love to see you! You can also contact us by telephone: our direct line is 22138. If calling from overseas, the international dialling code for St Helena is +290. Our general office email address is: statistics@sainthelena.gov.sh, or you can email team members directly (the format is firstname.lastname@sainthelena.gov.sh).
For more statistical data and reports, covering many aspects of St Helena’s social and economic development, please visit us on the web: www.sainthelena.gov.sh/st-helena/statistics.