This Bulletin releases new estimates of the value of goods imported to St Helena during the 2022/23 financial year. Detailed data tables accompany this release and can be downloaded here, and a PDF version of this Bulletin can be downloaded here.
Value of goods imported
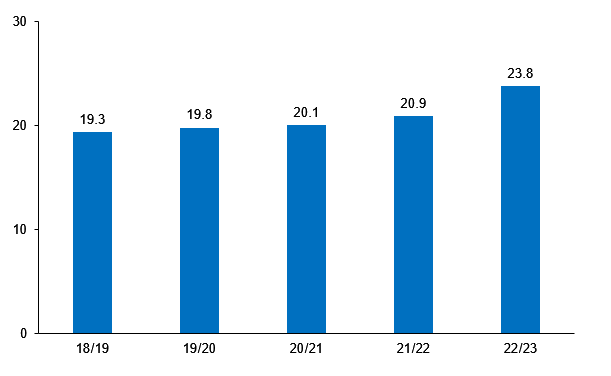
Chart 1 shows the total value of goods imported to St Helena for the last five years, which increased over this period by 23%. Most of this is due to inflation in the prices of goods purchased overseas, particularly in the United Kingdom and South Africa. The total value of imported goods in 2022/23 was £23.8 million, a 13.6% increase on 2021/22 (£20.9 million). However, much of this increase was due to the increase in price of imported mineral fuels, especially diesel and petrol. The price of these fuels increased by more than 50%, a consequence of the end of the COVID19 pandemic and the conflict in Ukraine.
Chart 1. Total imports of goods to St Helena, 2018/19 to 2022/23, £ millions (current prices, not adjusted for inflation)
Type of goods imported
Chart 2 shows imports for the last five financial years, classified into broad commodity groups. A large proportion of the value of St Helena’s imports are manufactured goods, machinery, and transport equipment. Road Vehicles is a major item in this group, with an imported value of £2.1m in 2022/23 and £1.4m the year before (2021/22); this category includes passenger cars and trucks, buses, commercial vehicles, and parts and spares.
Imports of machinery, manufactured goods, and vehicles vary from year to year and can be affected by large-scale infrastructure projects. For instance, in 2017/18, some of these imports were related to construction work connected to the Airport project, and more recently some imports in these categories were related to goods, machinery and equipment for the new undersea telecommunications cable and other infrastructure projects.
Chart 2. Imports of goods to St Helena by broad commodity group, 2018/19 to 2022/23, £ millions (current prices, not adjusted for inflation)
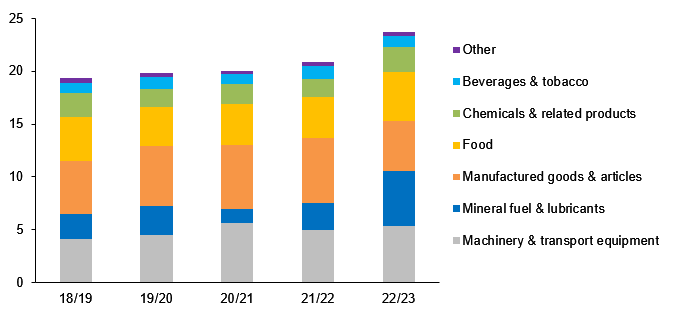
Some commodities are imported infrequently in bulk; the most significant is mineral fuel, which is imported via a fuel tanker arriving roughly once every three months, or four times a year, plus smaller quantities of aviation fuel imported via a general cargo ship. Although consumption of fuel is usually quite steady – it is used to generate electricity, and for air, road and sea transport – the annual total value of imports can vary depending on the timing of the arrival of the fuel tanker, as well as the price paid. This may help to explain the large increase in the value of fuel imports in 22/23, when the price of diesel and petrol increased by more than 50%, and there were five tanker deliveries. In 21/22 the volume of diesel and petrol delivered to the island was 3.5 million litres, or 883 thousand litres per delivery; in 22/23 4.1 million litres were delivered, about 828,000 litres per delivery.
Imports of food, beverages and tobacco
Food is the fourth largest group of imported goods in 22/23, with a value of £4.6m. Within the broad food grouping, imports of meat products had the highest value in 2022/23 of £993 thousand (Table 1). Cereals and cereal preparations were second (£844 thousand), and vegetables and fruit, and dairy products and eggs, were third and fourth in the table (£664 thousand and £570 thousand, respectively). The value of food imports increased in 22/23 by 15.8% compared to 21/22. Some of this increase is attributable to increases in the price of food in South Africa and the United Kingdom, although it is likely that not all of these price increases were passed to the consumer because import duties on food were lowered as a result of a St Helena Government policy to manage the high rates of inflation experienced globally in 2022/23.
The value of alcoholic beverages imported in 2022/23 was £452 thousand (before duty and freight charges), a decrease in the value in 2022/23. The value of tobacco imports was £235 thousand, an increase in the value compared to 2021/22.
Table 1. Imports of food, beverages and tobacco, 2019/20 to 2022/23, £ thousands (current prices, not adjusted for inflation)
| 19/20 | 20/21 | 21/22 | 22/23 | |
| Food | 3,639 | 3,842 | 3,947 | 4,570 |
| Meat and meat preparations | 775 | 670 | 953 | 993 |
| Cereals and cereal preparations | 532 | 670 | 666 | 844 |
| Vegetables and fruit | 554 | 530 | 540 | 664 |
| Dairy products and eggs | 480 | 429 | 505 | 570 |
| Other food products | 502 | 810 | 408 | 543 |
| Coffee, tea, cocoa, spices | 271 | 289 | 338 | 389 |
| Animal feed | 343 | 277 | 340 | 379 |
| Sugars and sugar preparations | 122 | 118 | 131 | 118 |
| Fish, crustaceans, molluscs | 59 | 49 | 66 | 70 |
| Beverages and tobacco | 1,152 | 1,000 | 1,277 | 1,050 |
| Alcoholic beverages | 580 | 494 | 713 | 452 |
| Non-alcoholic beverages | 386 | 335 | 389 | 363 |
| Tobacco and tobacco products | 185 | 171 | 175 | 235 |
Country of purchase of imported goods
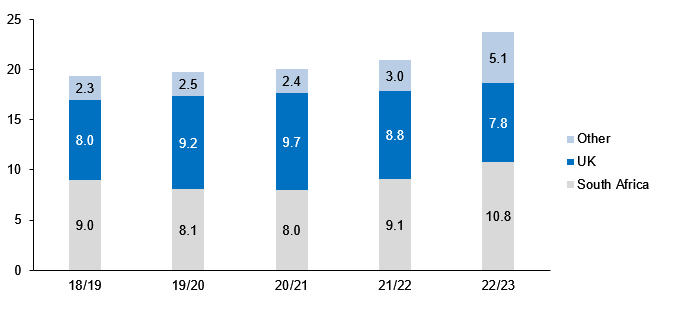
Most goods imported to St Helena are purchased in the United Kingdom or South Africa, reflecting the close ties between St Helena and the UK, and the historical cargo shipping routes between Cape Town in South Africa and Jamestown in St Helena. Historically, St Helenians tend to spend roughly the same in the UK and South Africa on imported goods (see Chart 3), although in 2022/23 more was spent in South Africa (£10.8 million) than the United Kingdom (7.8 million). Imports from other countries are mostly mineral fuel (see Table 2), which was until recently purchased from the Netherlands, but has been purchased from Namibia from 2022/23.
Some of the trends in Chart 3 are caused by price inflation and by the change in the value of the Rand compared to the Pound: goods from South Africa must be bought in Rand, the South African currency, and so the value of goods imported from there may reflect the value of the Rand compared to the St Helena Pound at the time of purchase. When the Rand weakens compared to the Pound, St Helenian importers can buy more goods with the same amount of St Helena Pounds – providing the price of those goods in Rand remains unchanged (in practice, a weakening currency is likely to result in price increases).
Chart 3. Imports of goods to St Helena by recorded country of purchase, 2018/19 to 2022/23, £ millions (current prices, not adjusted for inflation)
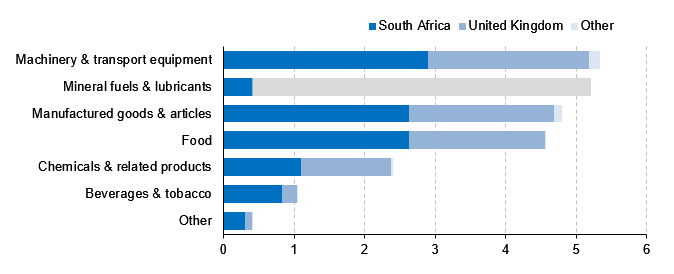
In 2022/23, almost 60% of all food imports were from South Africa, with over 40% from the United Kingdom (Table 2 and Chart 4). In the same year, more than half of the value of all machinery and transport equipment purchased was paid to South African suppliers, and most mineral fuel was purchased from suppliers in other countries. Over 80% of the value of imports for beverages and tobacco products was spent in South Africa.
Table 2. Imports of goods to St Helena by broad commodity group and country of purchase, 2022/23, £ millions
| South Africa | United Kingdom | Other | Total | |
| Machinery & transport equipment | 2.90 | 2.28 | 0.16 | 5.34 |
| Mineral fuels & lubricants | 0.41 | 0.01 | 4.79 | 5.21 |
| Manufactured goods & articles | 2.63 | 2.05 | 0.11 | 4.79 |
| Food | 2.63 | 1.92 | 0.01 | 4.57 |
| Chemicals & related products | 1.11 | 1.27 | 0.03 | 2.40 |
| Beverages & tobacco | 0.83 | 0.22 | 0.00 | 1.05 |
| Other | 0.31 | 0.10 | 0.00 | 0.40 |
| Total | 10.82 | 7.84 | 5.10 | 23.76 |
Chart 4. Imports of goods to St Helena by broad commodity group and country of purchase, 2022/23, £ millions
Methodology
The compilation methodology for international trade statistics on St Helena uses the guidelines published by the United Nations Statistics Division. More details on the international concepts and definitions can be found here: https://unstats.un.org/unsd/trade/imts/methodology.asp.
Data source
Statistics of imports of goods are derived primarily from the administrative records resulting from the Customs process, particularly the legal requirement for a declaration to be made to the Customs authorities whenever goods are imported or exported. These declarations are stored in a computer system called ASYCUDA, managed by the Customs Office. Although the Statistics Office conducts a number of consistency checks to identify and correct valuation and classification errors, the data quality of statistics on international trade depends on the quality of information entered into the ASYCUDA system by importers and by Customs officials.
Imports and exports
Generally, imports and exports are transactions involving the exchange of goods or services between residents and non-residents of St Helena. For goods, imports and exports are usually recorded whenever a commodity crosses St Helena’s boundaries, typically a border entry point, or a ‘bonded’ warehouse (a place where goods liable to import taxes are stored until those taxes are paid). For the purpose of St Helena’s import statistics, the date of customs duty assessment is usually taken to be a reasonable estimate of the date at which the commodity has effectively crossed the border.
Valuation
Values are reported in ‘current’ prices, that is, the value recorded at the time of the customs transaction, without any adjustment for price inflation (i.e. the changes in prices of commodities over time).
On St Helena, the value recorded by importers for the assessment of import taxes and duties is ‘free-on-board’ (or FOB), rather than inclusive of ‘cost, insurance and freight’ (or CIF); import statistics are therefore also based on the FOB valuation of goods. This means that St Helena’s import statistics are based on the invoice value paid by the importer in the country of purchase, and they do not include the costs of shipment, or any duties or taxes paid.
Goods are counted as imported when they enter the domestic economy; in this regard, goods imported into bonded warehouses are only counted when they are released from bond. Goods imported after being temporarily exported for repair are also not included. Similarly, machinery imported on a temporary basis, for example to support construction products, is not included.
Goods purchased with prices in foreign currency (such as the Rand) are valued in Pounds based on the exchange rate used for the Customs transaction, rather than the exchange rate used by the importer when they purchased the goods.
Volumes
The quality of the information collected by the Customs Office on the quantities of commodities imported does not currently permit the calculation of trade statistics on volumes or quantities.
Classification of commodities
Commodities are classified by importers on their customs declarations using an eight digit tariff code, which is based on the international six digit ‘Harmonised System’ classification maintained by the World Customs Organisation. In this report, and for the presentation of St Helena’s trade statistics generally, the Standard International Trade Classification is also used; this was developed for analytical purposes by the United Nations Statistics Division, while the Harmonised System is primarily designed for the administration of Customs systems. There are ‘correspondence tables’ between these two classification systems maintained by the United Nations, which enables St Helena’s trade statistics to be analysed and presented using either classification.
Data frequency
The trade statistics in this Bulletin are presented by financial year, and the Statistics Office currently analyses the ASYCUDA database every year. However, data are computed by quarter, which can allow calculation of trade statistics by calendar year, or by quarter if required. Any analysis of quarterly import statistics should be made with care, however, since they can be affected by the timing of cargo shipments in particular.
Trade in services
This Bulletin focuses on the imports of goods but it should be noted that St Helena’s trade with other countries also includes imports and exports of services. Imports of services include medical treatment and training programmes abroad, communications services, and services delivered by persons visiting the Island but who do not live on St Helena. St Helena’s service exports include spending on St Helena by tourists and short-term visitors; estimates of this non-resident spending on St Helena are available through the St Helena Statistics Office website.