4 April 2019
This bulletin includes updated demographic indicators including total population, arrivals, departures, births, deaths, and life expectancy.
Three primary sources have been used to compile this bulletin: population censuses (from 1978, 1987, 1998, 2008 and 2016); immigration records collected by the Immigration Office of the Police Directorate, and records of births and deaths collected by the Customer Service Centre at the Post Office. A full set of statistics and indicators can be downloaded in Excel format from the ‘Population’ file on the St Helena Statistics website at: www.sainthelena.gov.sh/statistics-data.
Total population
Estimates of the total population are calculated by combining the number of arrivals and departures and the number of births and deaths with the estimated total population from the population censuses. At the end of February 2019 the number of St Helenians on St Helena was estimated to be 4,332, an increase of 167 compared to February of the previous year. The total population on St Helena (residents and temporary visitors) was estimated to be 4,680 at the end of February 2019, around the same as the previous February when the estimate was 4,691.
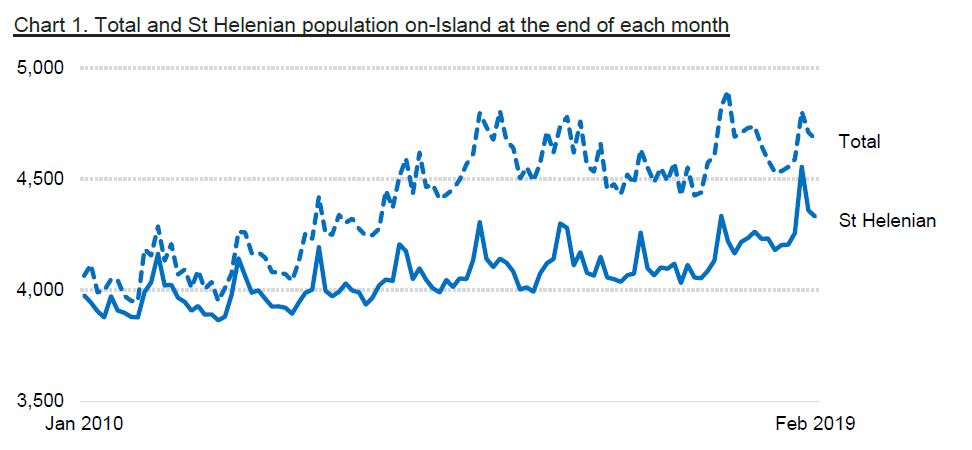
The marked recent increase in St Helenians is due to both the seasonal pattern (St Helenians living abroad tend to visit family and friends around the Christmas period in December and January), and the increased capacity of scheduled airplane arrivals following the introduction of a seasonal mid-week service from Johannesburg.
Arrivals and departures
The number of people arriving to and departing from St Helena (excluding day visitors from cruise ships) has been steadily increasing since 2010 (Chart 2). In the earlier part of the decade, this was due to the construction activity as the new airport was built, and lately this is due to the start of the regular scheduled air service towards the end of 2017.
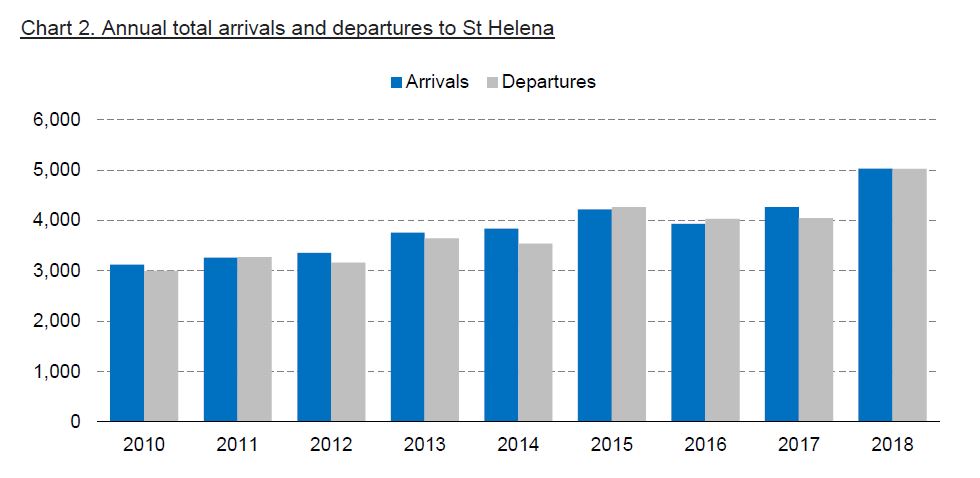
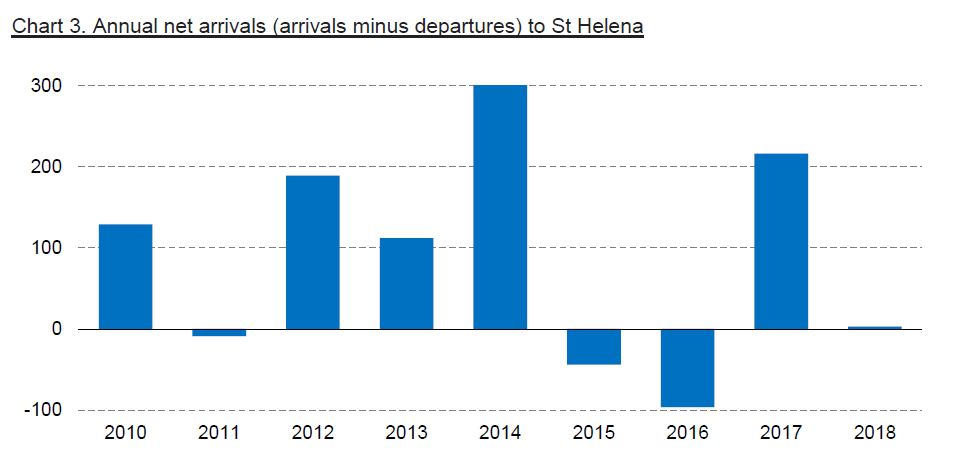
In most years since 2010, arrivals have exceeded departures, especially between 2012 and 2014 when the airport was being constructed (Chart 3). This in turn has led to the increase in the total population seen in Chart 1. In 2017, the overlap of the start of scheduled air services and the last voyage of the RMS St Helena led to unusually high arrivals in November and December.
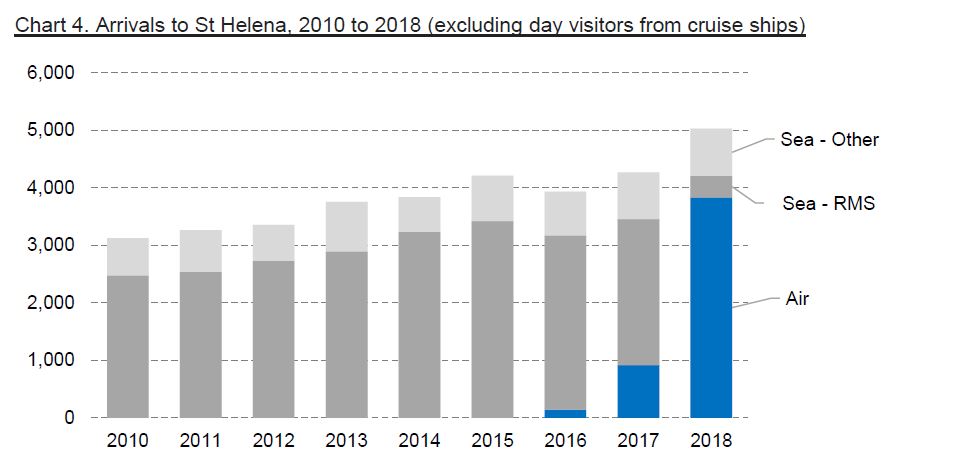
Following the completion of the airport, most people staying for more than one night on St Helena arrive by air, with a smaller number arriving by sea, mostly by yacht (Chart 4). In 2018, 5,030 people arrived on St Helena, excluding day visitors on cruise ships. Until 2018, most arrivals by sea were by ship on the RMS St Helena; 2018 saw 3,833 people arrive by air, more than arrived by the RMS St Helena in any previous year.
Almost half of all people arriving to St Helena in 2018 did so for a leisure-related purpose; they were either tourists (the largest group) or St Helenians living abroad returning for a holiday to see family and friends (Chart 5). Business arrivals, which includes people and their families arriving for both short- and long-term assignments, and returning residents made up just over a third of all arrivals.
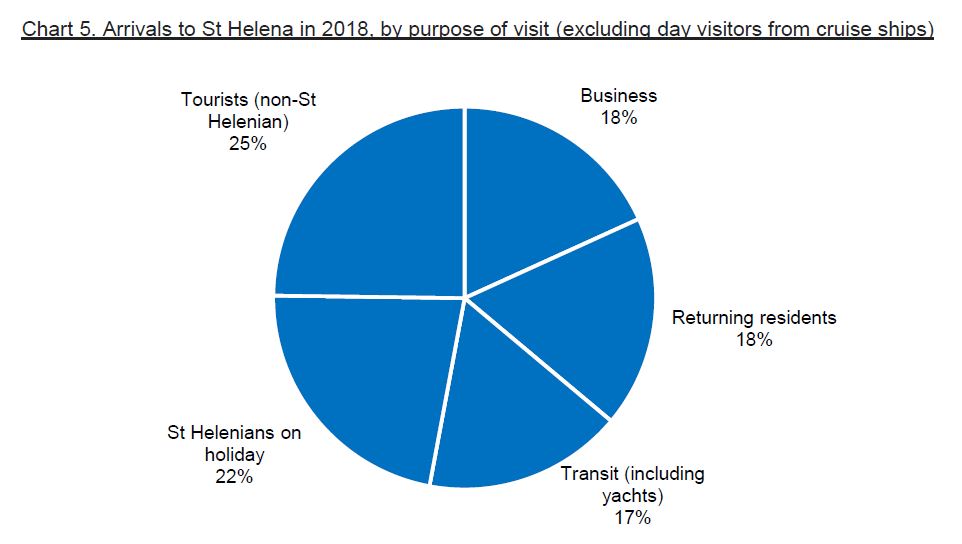
There is current interest in the number of people arriving for leisure purposes; in the regular statistics published by the Statistics Office, these are classed into two groups: St Helenians on holiday, typically visiting family and friends, and other (non-St Helenian) tourists.
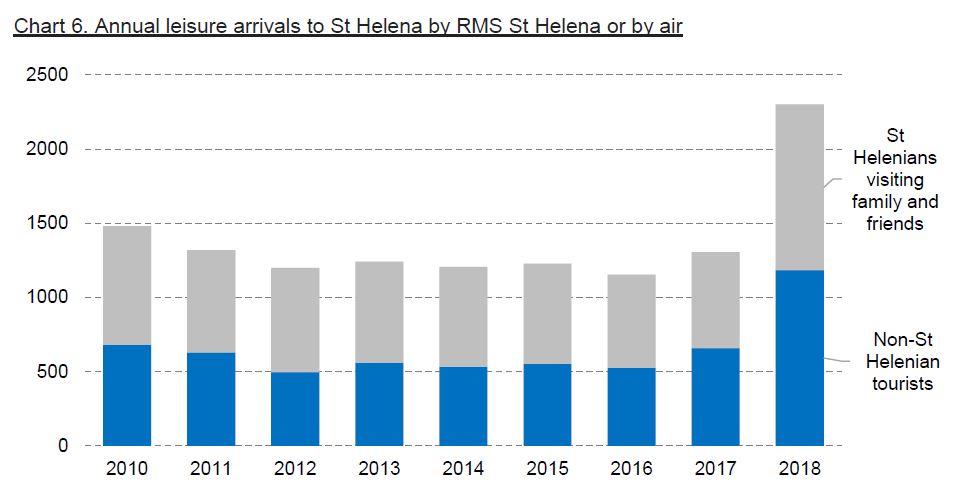
Chart 6 shows the trend in leisure arrivals for the last nine years for leisure arrivals either by the RMS St Helena or by air. The start of scheduled air operations in 2017 resulted in a large increase in leisure arrivals in both groups. Chart 7 illustrates the trend for non-St Helenian tourists only; in 2018, some 991 non-St Helenian tourists arrived by air, substantially more than arrived by the RMS St Helena in any of the previous eight years.
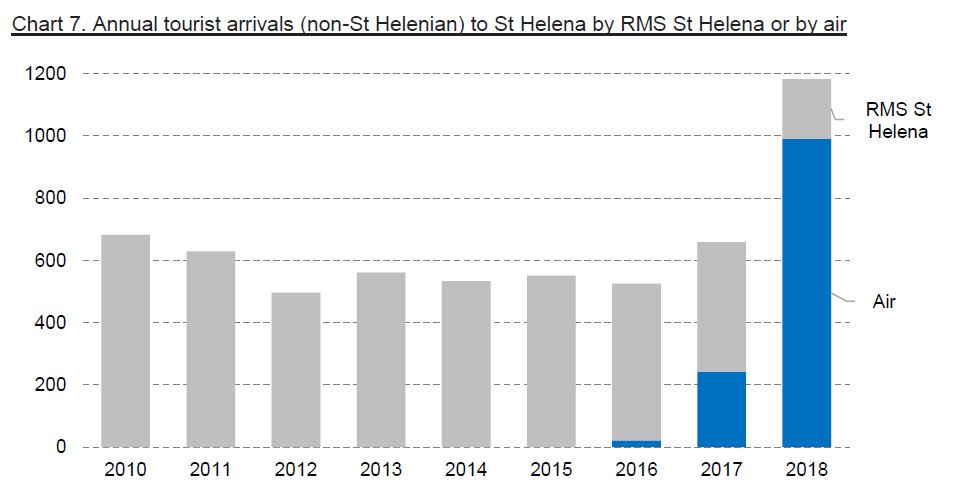
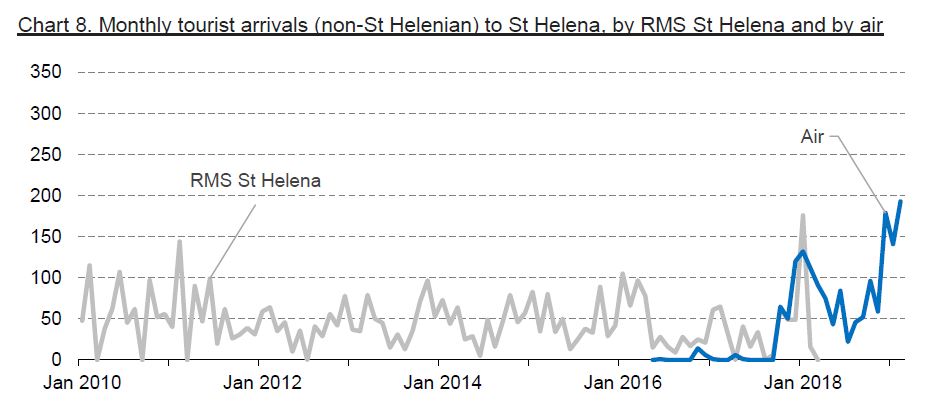
Chart 8 illustrates the monthly trend in non-St Helenian tourist arrivals by RMS St Helena or air. The trend is seasonal, with lower arrival numbers during St Helena’s cooler months around July and August, and higher numbers around the warmer months of December, January and February. Recent tourist arrivals by air have also been higher than in previous months; the total for February 2019 was 193, higher than the previous highest monthly total by air of 179 in December 2018. The number of tourist arrivals was very high in January 2018, when the last voyages of the RMS St Helena took place: tourist arrivals on the RMS were 176, and tourist arrivals by air were 132.
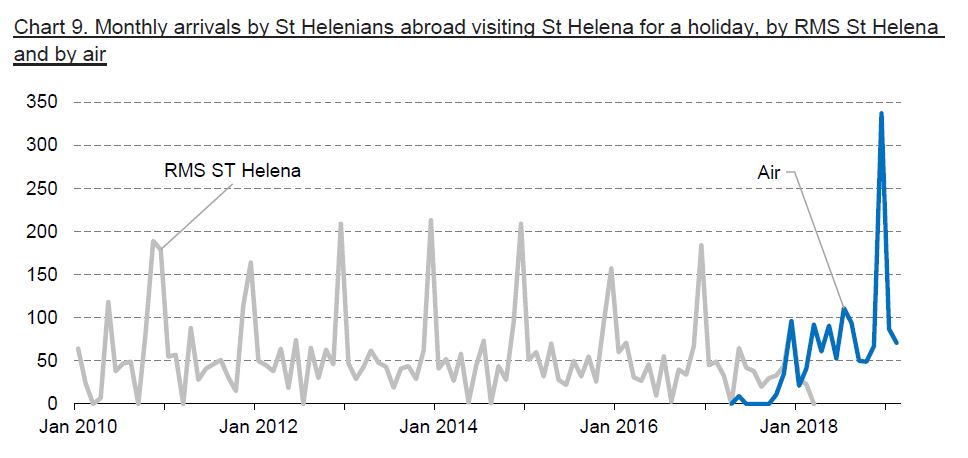
Arrivals by St Helenians visiting family and friends are also highly seasonal (Chart 9); the spikes represent arrivals in November or December each year, in time for the Christmas holidays. St Helenians living abroad have taken advantage of the air service: in December 2018, 336 St Helenians arrived to visit family and friends; the highest monthly total prior to that since 2010 was 213 in December 2013.
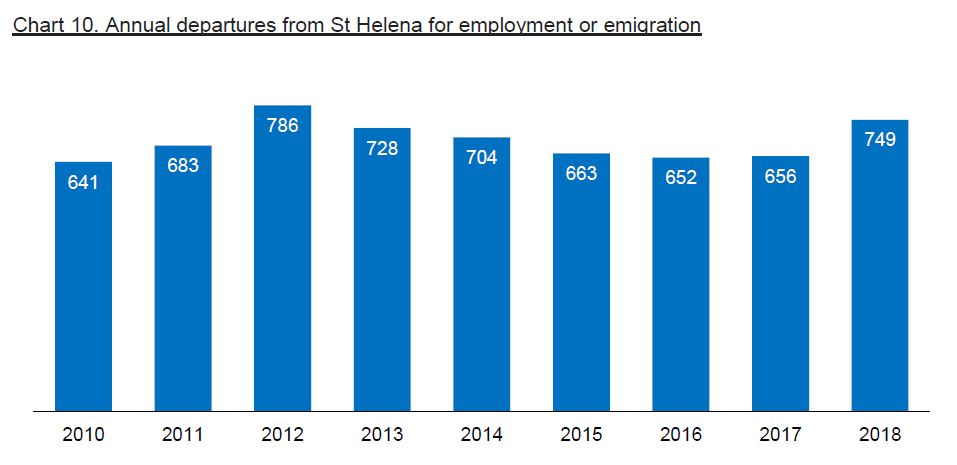
Each year, significant numbers of people leave St Helena either to find employment overseas, or to emigrate. In any of the last nine years, the lowest number of people leaving for employment or emigration was 641 in 2010 (Chart 10). This compares with 749 people leaving for these reasons in 2018, an increase compared to 2017, and a higher number than any of the previous five years – though not as high as 2012, when 786 people left St Helena for employment or emigration.
Births and deaths
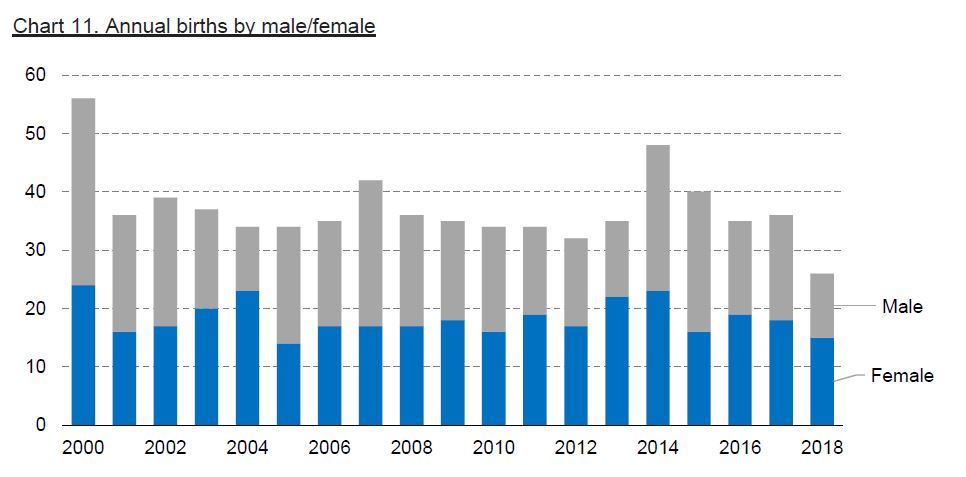
There were 26 births in 2018, half the number of deaths (52), and the lowest number of births in a year since at least the year 2000 (see Chart 11). The number of girls born in 2018 (15) was higher than boys (11), but over time there is an even split. For example, since 2000, 348 girls and 356 boys were born.
In 2018 there were 52 deaths, 20 female and 32 male. There have been a higher number of male deaths than female deaths in each of the last seven years, and since 2000 there have been a higher number of female deaths in only four years (Chart 12). Overall, since 2000, 98 more males have died (523 in total) than females (425 in total).
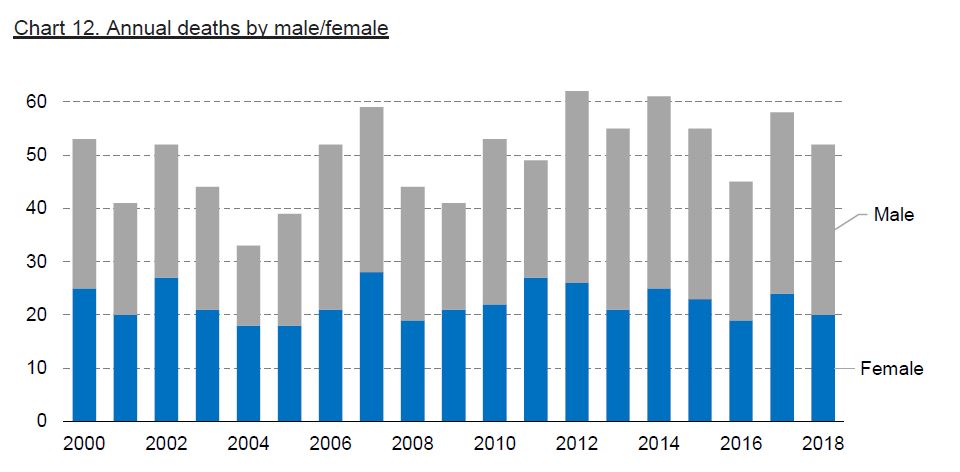
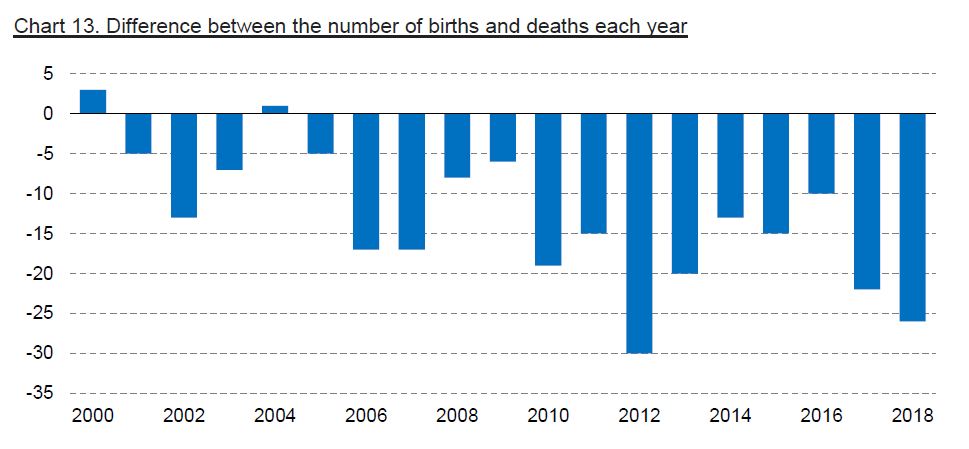
Chart 13 shows the net increase or decrease in the population due to births and deaths. Since 2000, the number of births has exceeded the number of deaths in only two years; since 2010, the number of deaths has exceeded the number of births by at least ten. This change in pattern is likely partly attributable to the departure of women of child-bearing age following the change in British citizenship laws in 2002.
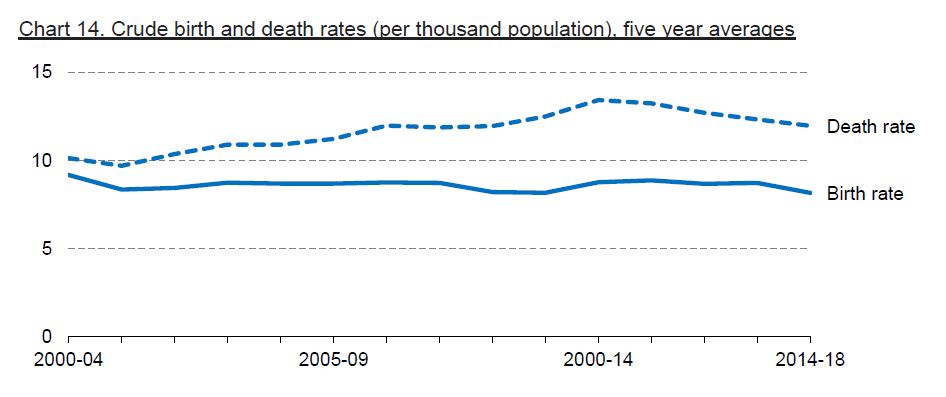
To help understand the patterns of births and deaths, the Statistics Office calculates crude birth and death rates, which are the number of births and deaths each year adjusted for the size of the total population. Because of the small number of births and deaths on St Helena, small fluctuations in numbers can cause sharp changes in these rates, so five-year averages are used to minimise this risk. Chart 14 shows the birth and death rate: the birth rate has been fairly stable at around nine births per thousand population, but since 2004 the death rate has climbed slightly and then fallen recently.
Life expectancy
The Statistics Office has recently updated its life expectancy estimates using the number of deaths for 2017 and 2018, and the 2016 population estimates from the Census. Life expectancy is the average number of years a person has left to live, assuming that person is subject to observed death rates. It is a useful statistic to calculate, especially life expectancy at birth, since it is used as a general demographic indicator and often forms the basis for comparisons of living conditions between countries. Annual age-specific death rates have been calculated using averages over ten-year intervals to reduce the impact of the natural variability in the small numbers of deaths (so, for example, 2018 uses deaths from 2009 to 2018). They also use estimates of population groups interpolated between population censuses, since age-group specific totals are not currently estimated. The variability in the estimates between years shown in Chart 15 is likely to be caused by these data limitations, rather than any sudden changes to underlying life expectancies and risk factors. For this reason, the simple linear trend is also shown, and the smoothed estimates are included in the data file.
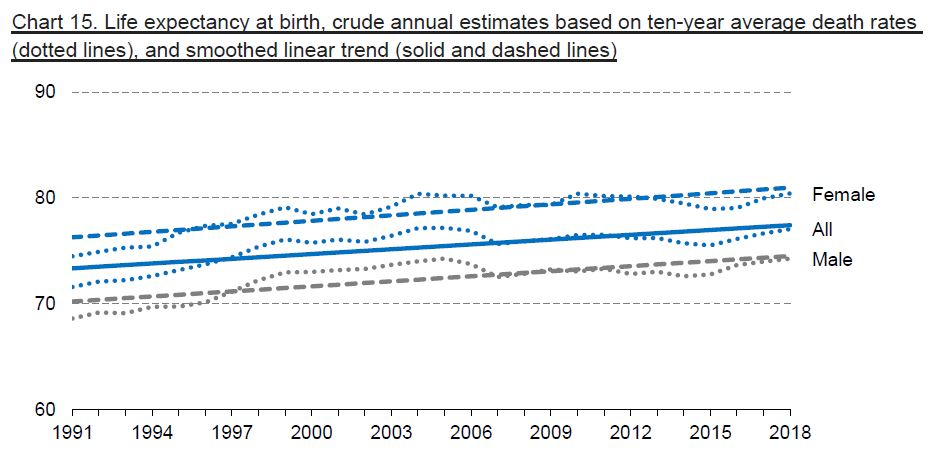
The latest 2018 estimate of life expectancy from Chart 15 is around 77 years; countries with similar rates of life expectancy include Argentina, Mexico, the United Arab Emirates, Poland, the Maldives, and French Polynesia. The UK has a higher life expectancy of around 81, and the USA is around 79 (the highest life expectancy in the world is 84 – Japan and Hong Kong). In common with the rest of the world, on St Helena women are expected to outlive men on average.
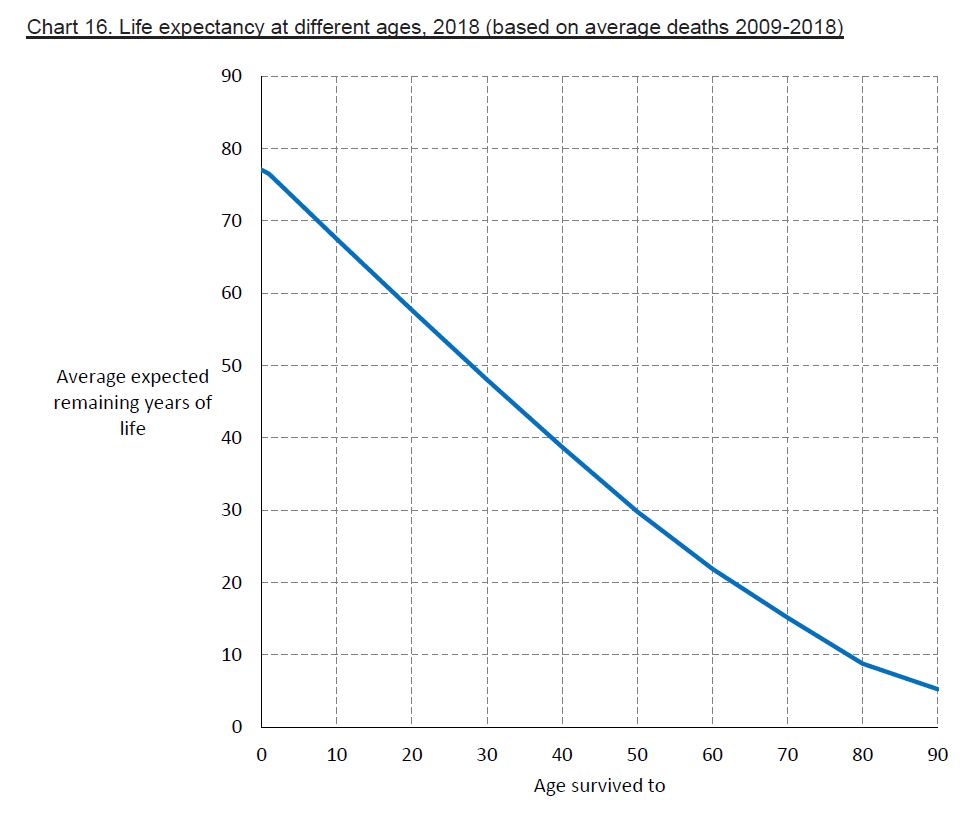
Typically, overall life expectancy increases slightly as a person ages – even though the expected remaining years of life decreases. For example, at birth, a person may be expected to live to 77, but if that person lives to 50, they may be expected to live to 80. Chart 16 tries to illustrate this; the horizontal axis shows the age of a person, and the vertical axis shows the number of expected remaining years of life having reached that age. So, a person of 50 years is expected, on average, to live another 30 years. To simplify the chart, males and females have been combined, but at every age women have a higher life expectancy than men.
Definitions and methodology
The classification of arrivals and departures into purpose of visit or departure is based on the declarations made to Immigration Officers. Tourism/holiday includes short-term visitors or departures (i.e. less than six months) for tourism or holiday purposes, and it includes St Helenians visiting short-term to see family and friends, both those that live permanently abroad and those who are away for a period of overseas employment. Day visitors arriving on cruise ships are not included in either arrivals or departures. Business and employment includes short-term and long-term arrivals who arrive for work purposes, including those employed by the St Helena Government on contract (and their families). Returning residents are people who are returning to their normal place of residence (for arrivals, this excludes those returning for the purpose of business or employment). It also includes people returning permanently from periods of overseas employment. Transit includes those for whom St Helena is not their final destination; it includes most arrivals by yacht and any people transiting to or from a ship via air.
Three categories of the total population are used. The on-Island population is an estimate of the total number of people on St Helena at the end of the given period (this is sometimes also referred to as the ‘de facto’ population). The resident population is an estimate of the total number of people living on St Helena (i.e. excluding any short-term visitors), regardless of their nationality. The on-Island St Helenian population is an estimate of the total number of St Helenians on the Island, regardless of their residence status.
Crude birth and death rates use five year averages of births and deaths, and five year averages of the estimated total mid-year on-Island population (at any year t, the years used for the averages are t-4, t-3, t-2, t-1, and t). Life expectancies are calculated using an ‘abridged’ life table with age groups 0-1, 1-4, 5-9, 10-19, 20-29, 30-39, 40-49, 50-59, 60-69, 70-79, 80-89, and an open-ended interval 90 years and above. The population totals used in the life tables are based on the St Helenian resident population at each census, with inter-census years based on simple interpolation for each age group. 2017 and 2018 use the latest published estimates of the on-island St Helenian population, with the same age-group patterns as 2016. Age-specific death rates are estimated using observed deaths for the previous ten years. Crude annual estimates and ‘smoothed’ estimates using a simple linear regression model have been calculated; data limitations and the small size of the St Helena population means that crude estimates are subject to year-on-year variability which may not reflect the underlying trend.