10 July 2018
About this Bulletin
This bulletin includes estimates of the latest annual price inflation rates for the second quarter of 2018, calculated from the Retail Price Index (RPI). The data released in this Bulletin, including the RPI itself, can be downloaded from the St Helena Statistics website at: www.sainthelena.gov.sh/statistics-data.
Average inflation rate
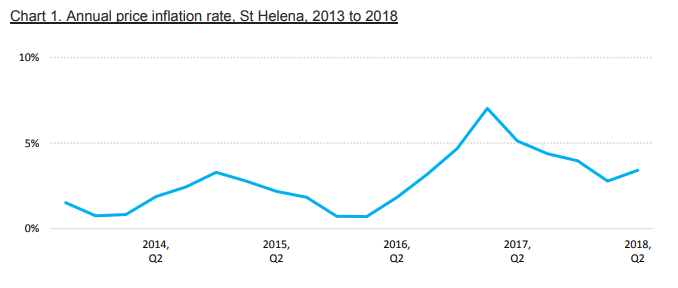
The latest rate of annual price inflation is estimated to be 3.4%, between the second quarter of 2018
and the second quarter of 2017. This is an increase from the previous annual price inflation rate for
the first quarter of 2018, which was 2.8% (Chart 1).
Inflation rates of RPI categories
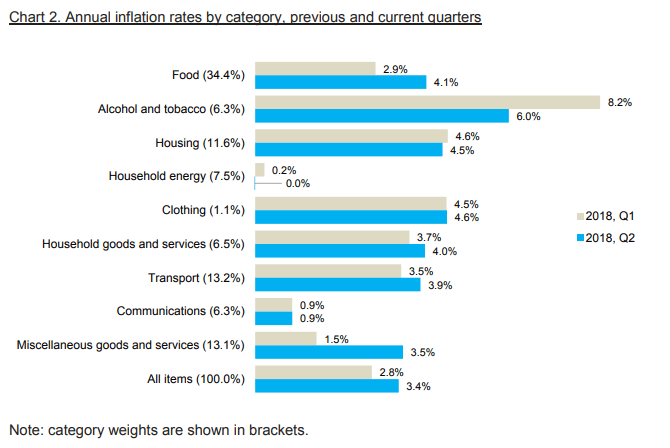
The category with the lowest annual inflation rate is ‘Household energy’, where prices at the end of quarter 2 2018 were unchanged compared to a year earlier. This is mostly due to unchanged prices for domestic electricity, which makes up over 85% of items in this group. Since the amount of electricity in the RPI is high (6.4%) based on average household expenditure patterns, this also has an impact on the overall inflation rate, offsetting some of the increases in other categories. ‘Communications’ also had a low annual inflation rate, at 0.9%.
Inflation rates for the other categories were all higher than 3%. Of these, ‘Alcohol and Tobacco’ had the highest rate, at 6.0% (see Chart 2). The annual increase in the price of food also increased quite sharply from 2.9% to 4.1%, and since food has a large weight in the RPI (34.4%, or around a third), this is a major factor in the observed rise in annual price inflation.
It should be noted that there were some changes to the composition of the ‘Communication’, ‘Miscellaneous’, and ‘Household goods and services’ categories as a result of the new classification
introduced for the 2017 Household Expenditure Survey (HES). For instance, non-communication services were previously included in the ‘Services’ category, but are now included in the ‘Miscellaneous’ and ‘Household goods and services’ categories. The previous ‘Services’ category is now ‘Communication’, and it now excludes non-communication services. The report on the 2017 HES results has more details of these changes (see page 8 of the report), including full details of the ‘rebasing’ exercise introduced for the RPI from Quarter 1, 2018. These changes mean than annual comparisons between these three categories should be made with care, since there are slight differences in their composition.
Price changes of selected goods and services
Since St Helena imports many goods from South Africa and the United Kingdom, prices paid by consumers are affected by the prices paid by importers for goods overseas, and the cost of importing those goods to St Helena, including freight rates and customs duties. During the first half of 2018 there were several changes which will impact prices of imported goods, including:
- Changes to the freight tariff caused by the retirement of the RMS St Helena and the introduction of a replacement shipping service, the MV Helena
- Changes in the exchange rate of the Pound against the Rand; the Pound strengthened slightly against the Rand towards the end of 2017, although it weakened again in the early months of 2018
- Price inflation in South Africa, which rose from an annual rate of 3.4% in March to 4.4% in May
- Price inflation in the UK – annual price inflation fell slightly from a November 2017 high of 2.8% to 2.4% in April and May 2018
- Changes in customs duty rates from May 1, 2018, including increases to taxes on alcohol and tobacco imports and sugary products including certain fruit juices, drinks, chocolate and confectionery, and decreases to some food and drink items, including water and certain fruit and vegetable products (see https://www.sainthelena.gov.sh/changes-to-customs-excise-duty
for full details).
Together, these factors can have varied and sometimes offsetting impacts on the overall inflation rate on St Helena. For example, significant quarter-on-quarter price increases were observed in sugar and syrup (11.8%), fruit juice (10.7%), and chocolate (10.6%), presumably reflecting the increase in duty rates for these products. At the same time, the recorded price of imported potatoes fell by 7.7% compared to the previous quarter, and imported gas cylinders also fell in price, by 4.4%.
There were also changes in the price of locally produced goods and services. The price of fresh beef, for example, rose by 9.5% compared to the previous quarter. Since beef comprises over 1.5% of the RPI shopping basket, this has a significant impact on the ‘Food’ inflation rate. Health service fees were also increased from 1 April (https://www.sainthelena.gov.sh/health-and-social-welfare/feescharges-residents), although the impact of these changes on the inflation rate is relatively small since the combined weight of these items in the RPI basket is just over 0.5%. At the time of writing this Bulletin, there are also proposed increases to the price of water (from 1 July) and telephone calls (August), but these are not included in the second quarter inflation rate calculations; their impact will be measured next quarter, when they are implemented.
Even though there are many factors that affect prices, it should also be noted that between each quarter many prices remain unchanged. This quarter, for example, of the 203 categories in the RPI,
prices in 153 categories – around 75% – did not go up or down compared to the previous quarter. In this quarter in particular, this may be one result of delays in shipments from the United Kingdom, since prices on the shelves may be maintained until new stock arrives.
Rebasing the Retail Price Index
The Statistics Office has recently ‘rebased’ the RPI, using the data collected from the Household Expenditure Survey in November 2017. This involved calculating new expenditure patterns to update the shopping basket, for example adding items which are relevant now (e.g. mobile telephones) and deleting any that are no longer purchased. The calculations in this Bulletin use this new basket; further details are available in the report on the 2017 HES which can be found at https://www.sainthelena.gov.sh/statistics-reports-and-publications.
Some common questions: what is the Retail Price Index (RPI)?
The RPI is the official measure of the average change in the retail prices of goods and services. It is estimated each quarter, or once every three months. Changes in the RPI measure retail price
inflation, and are usually computed on an annual basis; that is, comparing price changes over a twelve month period. For detailed tables, please visit www.sainthelena.gov.sh/statistics-data.
What is price inflation?
Inflation simply means that something is growing or increasing, but when used in the context of the economy it usually refers to the change in average prices of goods and services over time. On St
Helena, the primary measure of inflation is the RPI, and it is usually quoted as an annual estimate: it is the amount by which the RPI has grown over the preceding twelve months. A decrease in the RPI is also possible, though unusual – over a twelve month period, a drop in the RPI would result in retail price deflation (i.e. a negative inflation rate).
Why do we measure the RPI?
The rate of change of retail prices is an important indicator of economic performance and is used by Government, businesses and society in general. It enables an understanding of the impact of price changes on households and individuals, including for specific groups of goods and services.
How is the RPI constructed?
The basis for the RPI is the average cost of goods and services purchased by households on St Helena, or a weekly ‘shopping basket’. Items which households purchase more of, such as food,
have a bigger share, or weight, in the RPI basket. The current RPI uses a basket from the latest Household Expenditure Survey in 2017, and baseline prices for that basket were recorded in the first
quarter of 2018 (the full specification of the RPI basket is available in the report on the 2017 HES). Prices are collected every quarter, to calculate the latest price of the RPI basket and to compare that to the price in Q1 2018. By convention, the value of the basket in the baseline period is scaled to 100, and the RPI values are quoted in relation to that baseline – the usual notation is to write ‘Q1 2018 = 100’. An RPI value of 120 means that average prices have increased by 20 per cent compared to those recorded in the base period.
What happens when an item is not available?
If a particular item is not available during a round of price checks, a series of prescribed steps are followed to ensure the RPI measurement is not distorted. An important principle is that price changes should reflect actual price increases, and not changes in the quality of items. If an item is not available then either the previous price will be carried forward from the previous quarter, or a suitable substitute item will be identified and an adjustment calculation made. Great care is taken to ensure that this substitution is similar to the original item, that it represents the item category, and that it does not introduce error to the measurement of the RPI.