New estimates of economic activity on St Helena for 2021/22
This Bulletin presents new estimates of Gross Domestic Product (GDP) and Gross National Income (GNI) for 2021/22. The statistics and indicators presented in this Bulletin can be downloaded in Excel format here, and a version of this Bulletin is available in PDF format here. Other statistics on the St Helena economy can be found at: www.sainthelena.gov.sh/statistics/the-economy.
Gross Domestic Product
Gross Domestic Product (GDP) is a key indicator of economic activity used around the world: on St Helena it measures the total value of all the goods and services produced on the island during a year. For 2021/22, GDP at market prices is estimated to be £39.0 million and the annual change in the volume of goods and services produced by the economy (i.e., the annual growth rate) was estimated to be -1.7%, a decrease in GDP in real terms.
Table 1. Estimates of Gross Domestic Product, 2015/16 to 2021/22, £ million
| 15/16 | 16/17 | 17/18 | 18/19 | 19/20 | 20/21 | 21/22 | |
| Current basic prices | 35.6 | 33.1 | 33.9 | 36.5 | 36.2 | 37.2 | 37.1 |
| Current market prices | 41.6 | 38.8 | 36.3 | 38.2 | 37.8 | 39.2 | 39.0 |
| Constant 21/22 market prices | .. | .. | 38.7 | 39.8 | 38.7 | 39.6 | 39.0 |
| Annual GDP growth rate | .. | .. | .. | 2.9% | -2.6% | 2.3% | -1.7% |
For some purposes, it is better to use a measure of GDP which is adjusted for the size of the population. For 2021/22 GDP per capita was estimated to be £8,850 per person, or $12,120 (Table 2). When inflation is taken into account GDP per capita increased slightly, by 0.6%, compared to 2020/21. Countries with similar GDP per capita in 2021 were the Russian Federation ($12,190), Bulgaria ($12,220) and Costa Rica ($12,470), which were all slightly higher, and Palau ($12,080), Malaysia ($11,110) and Nauru ($10,650), all of which were slightly lower. Source: World Bank.
Table 2. Estimates of Gross Domestic Product per capita, 2015/16 to 2021/22
| 15/16 | 16/17 | 17/18 | 18/19 | 19/20 | 20/21 | 21/22 | |
| GDP per capita (£, current) | 8,960 | 8,570 | 7,930 | 8,190 | 8,330 | 8,690 | 8,850 |
| GDP per capita (£, constant 21/22 prices) | .. | .. | 8,440 | 8,520 | 8,540 | 8,800 | 8,850 |
| Annual GDP per capita growth rate | .. | .. | .. | 0.9% | 0.2% | 3.0% | 0.6% |
| Estimate of total on-island population | 4,639 | 4,528 | 4,601 | 4,693 | 4,563 | 4,527 | 4,422 |
| GDP per capita ($, current) | 13,510 | 11,200 | 10,530 | 10,760 | 10,620 | 11,370 | 12,100 |
When inflation is taken into account, GDP per capita expressed in St Helena Pounds has been growing slightly over the last four years, from an estimated £8,440 per person in 2017/18 to an estimated £8,850 per person in 2021/22. But expressed in current US dollars, GDP per capita has dropped from its 2015/16 level of $13,510 to $12,200 in 2021/22 – this is mainly due to the drop in the value of the pound compared to the dollar caused by the exit of the UK from the European Union (‘Brexit’).
Breakdown of value added by industrial activity
Table 3 shows the share of total value added by each major activity grouping (industrial activities are classified according to Revision 4 of the UN International Standard Industrial Classification, grouped to avoid disclosure of information about individual companies). Value added is the key component of GDP, and represents the total output of sole traders, businesses, government, and non-profit organisations, less the value of intermediate consumption. Intermediate consumption is the value of goods and services used in the process of producing final goods or services.
Table 3. Value Added by Industrial Activity, 2021/22
| GVA, £m | Share (%) | |
| A: Agriculture, Forestry and Fishing | 0.26 | 0.7 |
| B-E: Quarrying, Manufacturing, Electricity, Water, and Sanitation | 2.78 | 7.5 |
| F: Construction | 1.16 | 3.1 |
| G: Wholesale and Retail Trade; Repair of Motor Vehicles | 4.94 | 13.3 |
| H: Transportation and Storage | 1.53 | 4.1 |
| I: Accommodation and Food Service Activities | 0.51 | 1.4 |
| J-K: Finance, Insurance, Information, Communication | 6.14 | 16.5 |
| L: Real Estate Activities | 1.88 | 5.1 |
| M, N, R, S: Other Activities and Services, excluding Government | 1.16 | 3.1 |
| O-Q: Government, Public Administration, Health and Education | 16.74 | 45.1 |
| Total | 37.10 | 100.0 |
Apart from Government and Public Administration, which accounted for 45.1% of total value added in 2021/22, the largest groups were Finance, Insurance, Information and Communication (16.5%) and Wholesale and Retail Trade, including Repair of Motor Vehicles (13.3%). Production activities, including Quarrying, Manufacturing, Electricity, Water, and Sanitation, contributed around 7.5% of total value added in 2021/22, with Real Estate Activities (including rental properties and the value of owner-occupied housing) at 5.1% and Transportation and Storage (which includes the Airport) around 4.1%.
Chart 1. Value added by industrial activity, 2020/21 and 2021/22, constant 21/22 prices
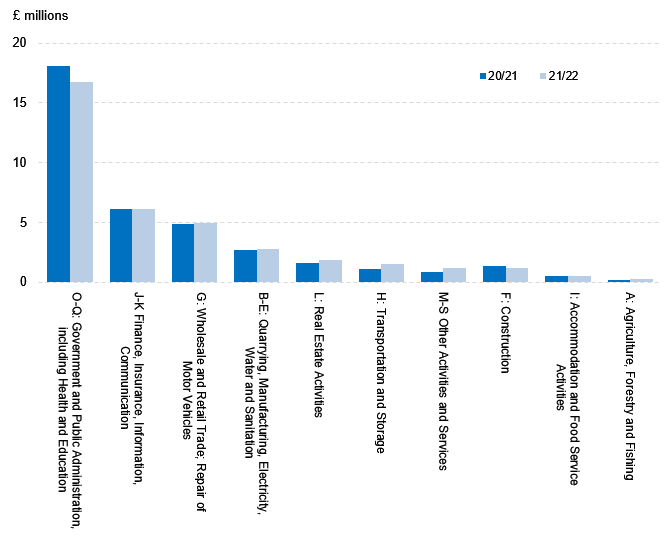
Chart 1 shows value added by each major industry group in 2020/21 and 2021/22. The biggest change was in Government and Public Administration (including Health and Education), which fell by around £1.3 million. One explanation of this fall is that the Government budget was increased in 2020/21 to mitigate the effects of the COVID-19 pandemic, including through the conversion of Bradley’s Camp into a quarantine and hospital facility, and support for those businesses most affected by the lower numbers of people visiting the island. Most of those costs were not sustained in 2021/22, leading to a lower budget and lower value added for the Government and Public Administration sector.
Gross National Income
A useful alternative measure to GDP is called Gross National Income (GNI), which values the economic activity of the Island’s residents, regardless of where that activity takes place. This is different to GDP, which is a measure of the total value of goods and services produced within the territorial boundaries of St Helena, regardless of whether that value is produced by its residents. GNI is derived from GDP by adding income earned abroad by residents and deducting income earned on St Helena by non-residents.
Table 4. Gross National Income, 2015/16 to 2021/22
| 15/16 | 16/17 | 17/18 | 18/19 | 19/20 | 20/21 | 21/22 | |
| Current market prices (£ million) | 36.7 | 35.7 | 34.9 | 37.6 | 37.6 | 39.7 | 39.2 |
| Per capita, current prices, £ | 7,910 | 7,890 | 7,590 | 8,010 | 8,230 | 8,770 | 8,870 |
| Per capita, current prices, $ | 11,930 | 10,320 | 10,070 | 10,520 | 10,490 | 11,470 | 12,120 |
| OECD aid threshold $ | 12,475 | 12,235 | 12,055 | 12,375 | 12,535 | 12,695 | 13,205 |
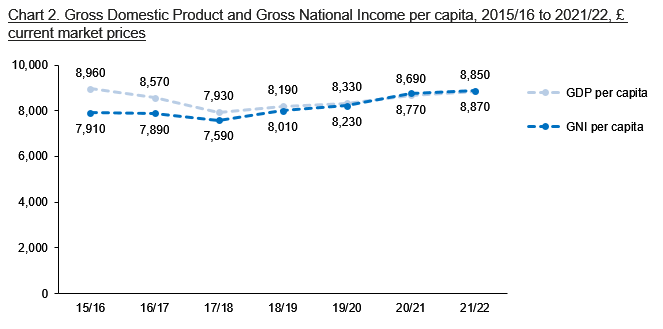
Table 4 shows the nominal levels of GNI per capita since 2015/16 and Chart 2 compares GNI per capita with GDP per capita between 2015/16 and 2021/22. GDP per capita was higher than GNI per capita until 2020/21; the difference between the two has narrowed as the construction work to build St Helena Airport came to an end, around 2017.
Chart 2. Gross Domestic Product and Gross National Income per capita, 2015/16 to 2021/22, £ current market prices
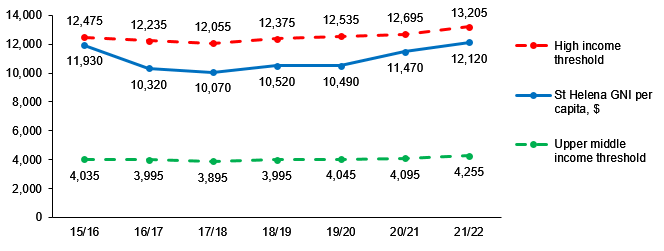
An important use of GNI per capita is to determine whether resource flows from one government to another can be classified as ‘Official Development Assistance’ by the Organisation of Economic Cooperation and Development (OECD); such flows are also often simply called ‘overseas aid’. The rule is that they can, as long as the country receiving those flows is classed as a low, lower-middle, or upper middle income country by the World Bank in at least one of the three years prior to the point at which the determination is made. The classification threshold used by the World Bank to classify countries as high income or upper middle income are adjusted each year, and are shown in Chart 3.
St Helena’s GNI per capita level means that it currently falls into the ‘upper middle income’ country classification, so the financial flows it receives from the United Kingdom and other official aid donors can be classified as Official Development Assistance. It was close to the high income threshold in 2015/16, when the new Airport construction was underway, but the threshold is calculated in US dollars and the fall in value of the Pound that followed the Brexit vote widened the gap in 16/17 and in subsequent years. However, the gap has narrowed again in 2020/21 and 2021/22, in part because the overseas earnings of the deposits of the Bank of St Helena increased significantly (and those earnings are included in GNI but not in GDP), and in part because the value of the Pound has strengthened slightly compared to the US dollar.
Chart 3. Gross National Income per capita and World Bank High Income and Upper Middle Income classification thresholds, 2015/16 to 2021/22, $ current market prices
Notes and Methodology
Revisions: GDP estimation and measurement methods are complex and development of St Helena’s National Accounts is an ongoing programme of work. All estimates published in this bulletin should be considered provisional and subject to future revision as additional data sources become available and further improvements are made to the methodology.
Approach: There are three basic methods of compiling total GDP: the expenditure, income, and production (or output) approaches. Prior to 2016, St Helena published estimates based on the expenditure approach, and in 2016 a figure for 2014/15 was published based on the income approach. This Bulletin presents estimates based on the production approach. As far as practicable in a small economy with limited resources for compiling GDP statistics, the methods used aim to follow the international guidance published in the ‘2008 System of National Accounts’ by the United Nations.
GDP at basic prices: Estimates at basic prices are derived as the sum of the gross value added of companies and government consumption expenditure, plus the incomes of sole traders, and an estimate of the rental value derived by households from the owner-occupation of their homes. The valuation of the output of government has been made on a net basis, excluding an estimate of asset depreciation (this is common in other small countries). Taxes on production are small and have not generally been included, so the value of GDP at basic prices is roughly equivalent to factor cost.
GDP at market prices: GDP at market prices is derived by adding total indirect taxes on products and production (including customs duties and service taxes) to total GDP at basic prices, and subtracting regular government subsidies to companies. This is consistent with the recommendations in the guidelines issued by the United Nations.
Inflation adjustment: Estimates are presented in both nominal and real terms, referred to in this bulletin as current prices and constant 2021/22 prices. Estimates in nominal terms will change due to both the effect of price changes and because of growth in the size of the economy. But changes in the size of the economy can only be measured using estimates expressed in real terms, adjusted for price inflation. Estimates in real terms have been calculated using the recommended method of using specific inflation estimates for each industrial grouping of economic activity, an improvement on past practice of using St Helena’s Retail Price Index.
Measurement issues: There are significant measurement difficulties in obtaining accurate source data for estimating GDP and related indicators for St Helena. Additionally the recommended measurement frameworks and concepts are not always well suited to measuring economic activity in small, aid-dependent economies. Estimates are very sensitive to timing issues and to recording or classification conventions, which while appropriate for larger economies may distort trends and levels in smaller countries. There are further measurement difficulties in calculating GNI; in particular, there are very limited data sources to estimate the income earned abroad by resident individuals and companies and the income earned on St Helena by non-resident individuals and companies.
Per capita estimates: For calculating per capita estimates of GDP and GNI, the population total used is the average of the end of month on-Island population estimates for the period, as published on the St Helena Government website by the Statistics Office.
Currency conversion: For converting from St Helena Pounds (£) to United States Dollars ($), the average daily spot rates published by the Bank of England have been used, based on an average for each financial year.
Data sources: The primary sources that have been used to compile GDP and related measures include Business Surveys conducted by the Statistics Office, Income Tax returns, published company accounts, and population estimates published by the Statistics Office. Thanks are extended to all the companies and businesses that have responded to past Business Surveys, and to the Income Tax Office for their cooperation and help in using the data from tax returns for this purpose. Data confidentiality is maintained in accordance with the requirements of the 2000 Statistics Ordinance.
Technical advice and support: Compiling estimates of Gross Domestic Product and related National Accounts is a highly specialised task that has only been possible because of the technical advice and support provided by the Office of National Statistics (ONS) Methodology Advisory Service in the United Kingdom – thanks are especially due to Jim O’Donoghue and Robin Youll.
Have more questions or comments?
Please get in touch: we are Neil Fantom, Chief Statistician, and Kelly Clingham and Justine Joshua, Senior Statistical Assistants. You can find us in person at the Statistics Office on the top floor of the Post Office Building, Jamestown. You can also contact us by telephone on 22138; if calling from overseas, the international dialling code for St Helena is 290. Our general office e-mail address is statistics@sainthelena.gov.sh, or you can email team members directly (the format is firstname.lastname@sainthelena.gov.sh).