9 January 2019
This bulletin includes estimates of the latest annual price inflation rates for the fourth quarter of 2018, calculated from the Retail Price Index (RPI). The data released in this Bulletin, including the RPI itself, can be downloaded from the Statistics Data page.
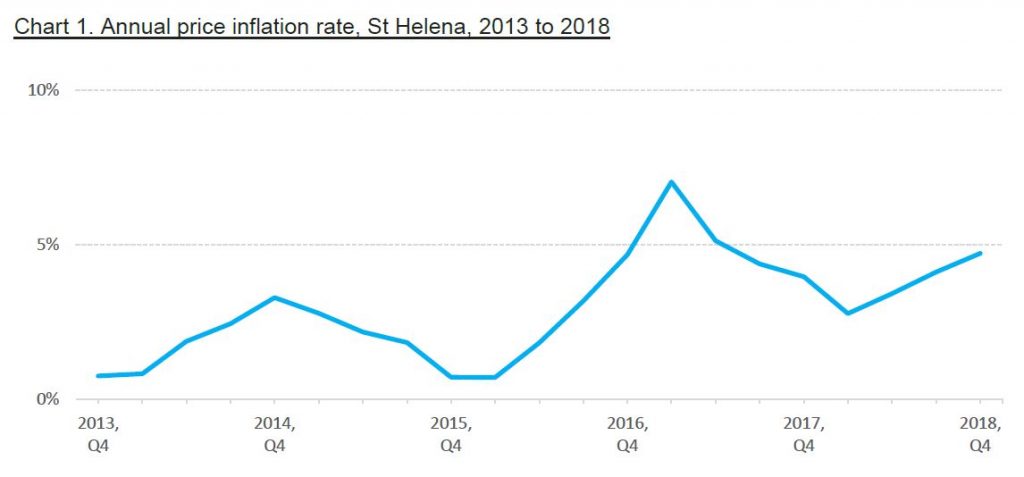
Average current inflation rate
The latest rate of annual price inflation is estimated to be 4.7%, between the fourth quarter of 2018 and the fourth quarter of 2017. This is a 0.6 percentage point increase from the previous quarter, when the annual price inflation rate was measured at 4.1% (Chart 1).
Contributing factors
This quarter saw price changes in about a third of the items in the average household ‘shopping basket’ used to compute the Retail Price Index. Notable increases include the price of food (especially bread), road traffic licences, and television subscriptions, which all have relatively high weights (or quantities) in the basket.
External factors play a significant role in price changes on St Helena. These include exchange rates, freight and shipping costs, and price increases in goods purchased in the United Kingdom and South Africa. In November 2018, annual inflation was measured at 5.2% in South Africa, an increase from 4.9% in August 2018. A compounding factor is the relatively low value of the UK pound caused by the Brexit process, but a mitigating factor is that UK annual inflation fell slightly compared to the previous quarter, to 2.3%.
Inflation rates of RPI categories
All categories experienced positive inflation during Quarter 4 2018 (in other words, the average prices in each category increased, compared to a year ago). ‘Communications’ remain the category with the highest annual inflation, 10.4% currently compared to 10.8% the previous quarter; this is mostly the result of the increase in telephone tariffs from Q3 2018. Tariff increases in both government and private sector service fees also resulted in increased inflation within the ‘Miscellaneous goods and services’ and ‘Transport’ categories. The ‘Food’ category saw a two percentage point increase between quarters 3 and 4 2018, the combined effect of increases in highly weighted items such as local bread and price increases in other food items. The average price of food, as measured by the representative items collected in the shopping basket, has increased by almost 5% compared to this point last year.
As the price of domestic electricity has remained static, the ‘Household Energy’ expenditure category has the lowest annual inflation rate at 1.3%. The annual price increase in the ‘Clothing’ and ‘Housing’ categories also fell, to 2.3% and 2.7% respectively.
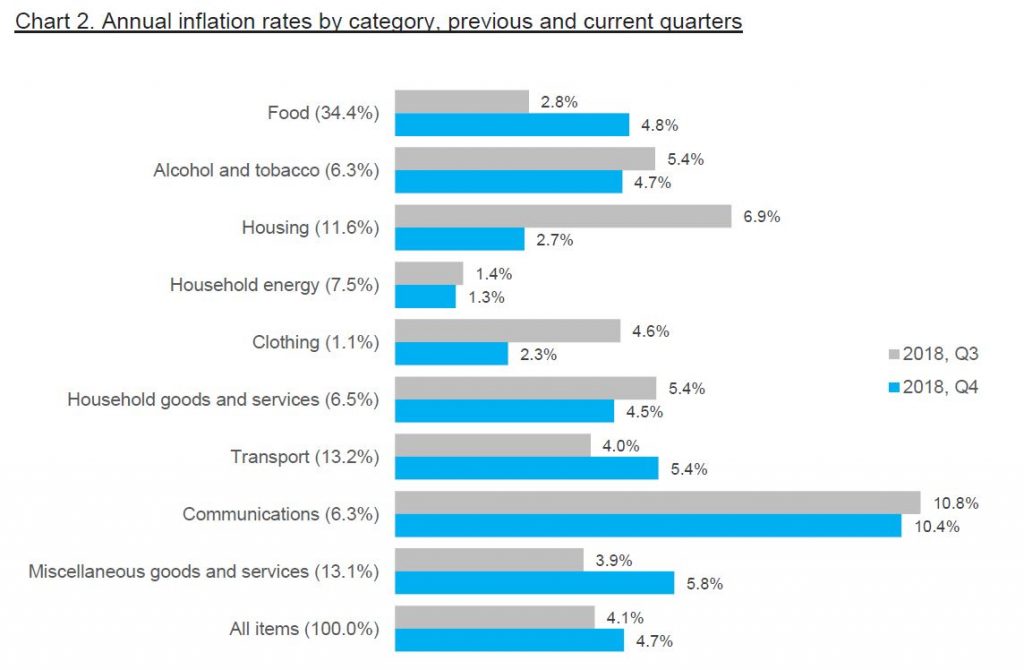
Note: category weights are shown in brackets.
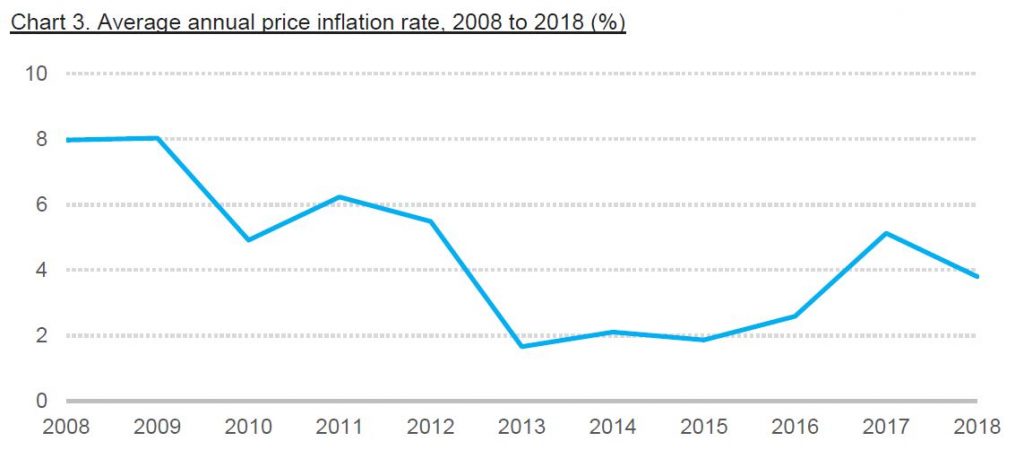
Average inflation for 2018
The average annual inflation for 2018 was 3.8%, calculated as the average of the rates for the four quarters that make up the 2018 calendar year. This is a lower rate than last year, when the average annual rate was measured at 5.1%, however it is still higher than the four previous years (2013-2016).
Using the average annual inflation rate may be more useful for some purposes, since it estimates the inflation rates experienced over the entire year – the annual rates measured each quarter may be more volatile.
What is price inflation?
Price inflation is the change in the average prices of goods and services over time. The rate of price inflation is calculated from the change in the Retail Price Index (RPI), which is the official measure of the average change in the prices of goods and services paid by consumers. The RPI is estimated each quarter, or once every three months, and the rate of price inflation is usually quoted on an annual basis; that is, comparing price changes over a twelve month period. Prices and the RPI tend to go up, but they can occasionally go down – which is price deflation.
Why do we measure inflation?
An accurate measure of price inflation helps understand the extent and nature of the impact of price changes on the government, businesses, households and individuals.
How is the RPI calculated?
The basis for the RPI is the average weekly cost of goods and services purchased by households on St Helena, sometimes called the ‘shopping basket’. Items which households purchase more of, such as food, have the biggest share of the RPI basket. The current RPI uses a basket from the latest Household Expenditure Survey in 2017; prices of the items in the basket are collected every quarter, and the price of the total basket is compared to the price in the baseline period, the first quarter of 2018. By convention, the value of the basket in the baseline period is scaled to 100, and the RPI values are quoted in relation to that baseline. For example, an RPI value of 120 means that average prices have increased by 20 per cent compared to those recorded in the baseline period.
Where can I get the data?
For detailed tables of the RPI and annual inflation rates from 1994 onwards, please visit the Statistics Data page and download the ‘inflation’ data file. Other datasets, bulletins and reports are also available on our home page.