19 July 2023
New estimates of the Retail Price Index and Inflation for Quarter 2, 2023
Estimates of the Retail Price Index and price inflation rates have been calculated for the second quarter of 2023. Detailed statistics in Excel format, including price indices and inflation rates by category of expenditure, can be downloaded here, and a PDF version of this Statistical Bulletin can be downloaded here.
About the Retail Price Index
The Retail Price Index (RPI) is a statistical measure of the change in retail prices on St Helena. An increase in the RPI means that, on average, prices have gone up since the last time they were measured, and a decrease in the RPI means that, on average, prices have fallen. It is important to understand that the RPI is an average measure: if it goes up, it does not mean that all prices have gone up, and similarly, if it goes down, it does not mean that all prices have fallen.
Latest index value and inflation rates
For the second quarter of 2023 the RPI has been measured at 115.3, an increase compared to the first quarter, when it was 114.8 (Chart 1).
Chart 1. Retail Price Index, Q2 2016 to Q2 2023
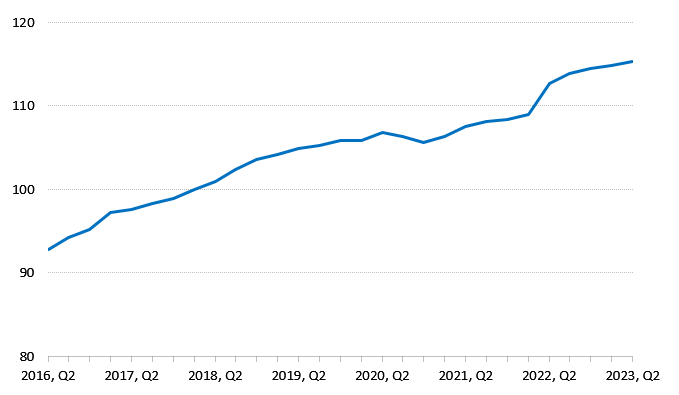
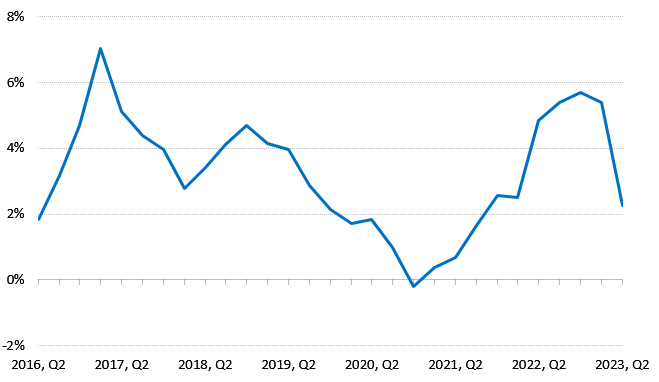
A year ago the RPI was 112.8, resulting in an annual inflation rate of 2.2%, comparing prices in the second quarter of 2023 to the same time period in 2022. The previous annual inflation rate (Q1 2023) was 5.4% (Chart 2).
Chart 2. Annual inflation rate, Q2 2016 to Q2 2023
Price changes in the last year
The index uses 203 representative items to measure price changes in nine different categories of household spending. Since a year ago, 81 items increased in price, 31 items decreased in price, and the price of 91 items remained unchanged. All categories within the index saw an increase over the past year (Chart 3), apart from Communications, which has remained unchanged, and the Transport and Household Energy categories.
Average prices over the year in the Clothing and Food categories rose the most, 5.8% and 5.6% respectively. Changes in stock and increases in the average prices of footwear contributed to the increase in the Clothing category, although the impact of these price changes on the overall index is quite small because Clothing has a low weight (1.1%). Food was impacted most by increases in oil-based products, including cooking oil, likely due to the continued effect of the conflict in Ukraine.
The decrease in the Transport category is a result of the recent fall in the price of Petrol and Diesel, compared to the price a year ago, even though the price of these two commodities is still relatively high compared to prices in 2021 – last year, in the second quarter of 2022, fuel prices rose by an average of 60% compared to prices in 2021.
Chart 3. Annual price change by category, St Helena (Q2 2022 compared to Q2 2023)
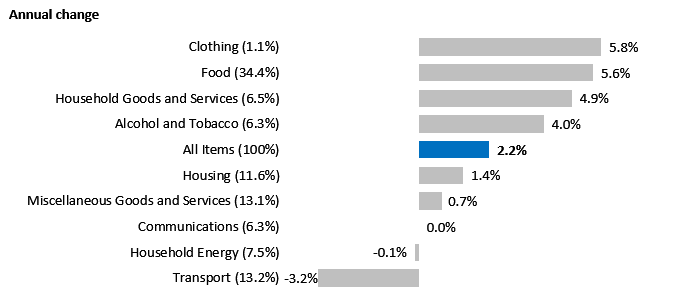
Note: category weights are provided in parentheses; these indicate the extent to which different categories are represented in the overall index. Categories with higher weight have a greater contribution to the index than categories with lower weights.
Price changes in both the UK and South Africa have a strong impact on prices on St Helena, since the majority of goods imported to St Helena are purchased in those two countries. In May 2023, annual consumer price inflation in the UK was measured at 8.7% (UK Office for National Statistics) unchanged from April, and in South Africa it was measured at 6.3% (Statistics South Africa) down from 6.8% from April. Changes in the value of the Rand compared to the Pound also have an effect on the price of goods purchased in South Africa, and over the last twelve months the Pound has fluctuated around 21 Rand per Pound, peaking at around 23 Rand per Pound in June this year – in other words, the Pound is stronger against the Rand than it was in 2022. The impact of this is that goods from South Africa become slightly cheaper for St Helenian importers.
Price changes in the last quarter
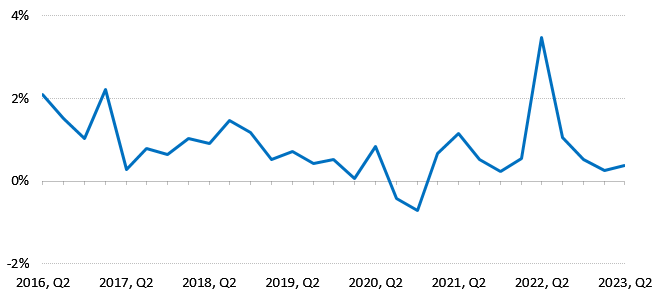
Shorter-term changes in prices can be measured by comparing the index with its value in the last quarter, three months ago (i.e. with Q1 2023). Charts 4 and 5 illustrate these quarterly inflation rates; typically they are often lower than the annual rates, since they measure price changes over a much shorter period. Between Q1 of 2023 and Q2 of 2023, average prices rose by 0.4%: 30 prices rose, 19 prices fell, and 154 prices remained unchanged.
Chart 4. Quarterly inflation rate, Q2 2016 to Q2 2023
On average, prices of items representing Clothing rose the most over the quarter, 6.3% between Q1 and Q2 of 2023, although prices within this category can be quite volatile (due to changes in the items stocked by retailers), and the weight of Clothing in the RPI is quite low, at 1.1%. Food rose by 1.3% compared to the previous quarter, with the two highest quarterly increases measured in representative items for fresh fruit and cooked meals. The Transport category saw the biggest fall in average prices over the quarter, with the same cause as the fall in the annual inflation rate, namely the recent decrease in both petrol and diesel prices in July 2023.
Chart 5. Quarterly price change by category, St Helena (Q1 2023 compared to Q2 2023)
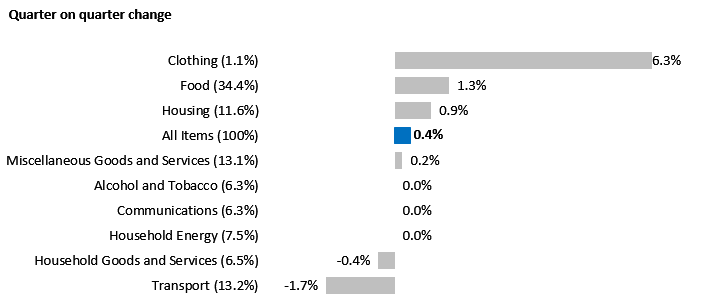
Note: category weights are provided in parentheses; these indicate the extent to which different categories are represented in the overall index. Categories with higher weight have a greater contribution to the index than categories with lower weights.
Some Frequently Asked Questions
What is price inflation?
Price inflation is the change in the average prices of goods and services over time. The rate of price inflation is calculated from the change in the RPI, which is the official measure of the average change in the prices of goods and services paid by consumers. The RPI is estimated each quarter, i.e. once every three months, and the rate of price inflation is usually quoted on an annual basis; that is, comparing price changes over a 12-month period. Prices and the RPI tend to go up, but they can occasionally go down – which is known as price deflation.
Why do we measure inflation?
An accurate measure of price inflation helps understand the extent and nature of the impact of price changes on the government, businesses, households and individuals. Inflation rates are often used in budgeting and accounting processes so that costs can be adjusted for the effect of price changes.
How is the RPI calculated?
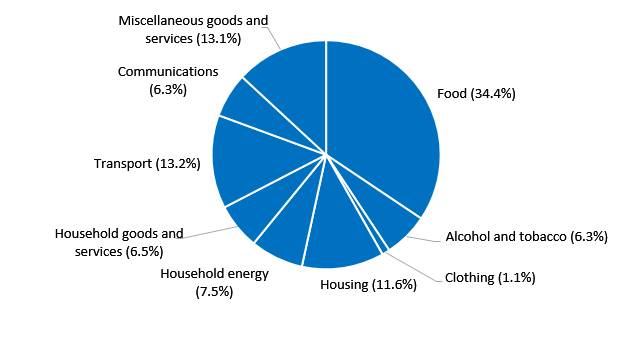
The basis for the RPI is the average weekly cost of goods and services purchased by households on St Helena, sometimes called the RPI ‘shopping basket’. Items which households purchase more of, such as food, have the biggest share of the RPI basket. The current RPI uses a basket from the latest Household Expenditure Survey in 2017; prices representing the groups of items in the basket are collected every quarter, and the price of the total basket is compared to the price in the baseline period, the first quarter of 2018. By convention, the value of the basket in the baseline period is scaled to 100, and the RPI values are quoted in relation to that baseline. For example, an RPI value of 120 means that average prices have increased by 20 per cent compared to those recorded in the baseline period.
Composition of average household weekly expenditure (Q1 2018 RPI ‘Shopping Basket’)
What happens when items are not available?
If an item of the ‘basket’ is not available then either the previous price will be carried forward from the previous quarter, or a suitable substitute item will be identified and an adjustment calculation made. Care is taken to ensure that this substitute item represents the item category and that it does not introduce error to the measurement of the RPI. An important principle is that price changes should reflect actual price increases and decreases, and not changes in the quality of items.