Latest index value and inflation rates for Q4 2025

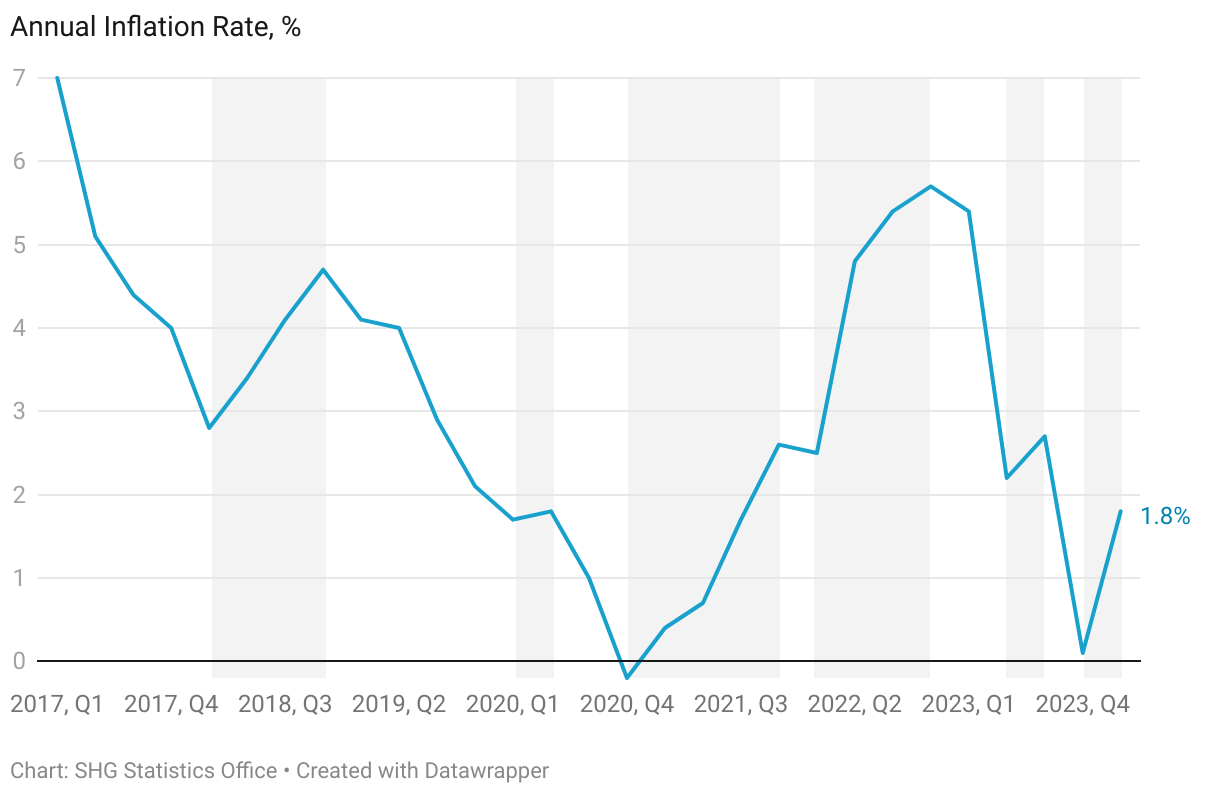
The latest estimate of the Consumer Price Index (CPI) has been released by the St Helena Statistics Office, for the fourth quarter of 2025 (Q4 2025). The CPI has been measured at 105.4, a small increase of 0.5% on the previous quarter (Q3 2025) and a 2.2% increase compared to a year ago (Q4 2024). This annual inflation rate of 2.2% is a drop in the rate of 2.6 percentage points compared to the rate measured in Q3 2025, which was 4.8%.

Line chart

Price changes over the last year

On average, the majority of broad groups of items saw their prices rise compared to a year ago, apart from Clothing. The highest average annual increase was in Household Energy (10.2%), the result of increases to the Electricity tariffs introduced in July 2025. Electricity is the highest weighted individual commodity in the current basket, therefore price changes to this item have a significant impact on the overall annual inflation rate. Alcohol and Tobacco increased by 6.1% during the year between Q4 2024 and Q4 2025, driven mainly by increases in the price of tobacco and wine products.

One of the most significant changes this quarter is in the Food category, where the annual inflation rate fell by 6.2 percentage points, from 6.9% in Q3 2025 to an estimated 0.7% in Q4 2025. Food constitutes over a third of the basket, and this change is partly due to a decrease in the price of some common food items, such as pork and cheese products. Prices in the Communications category are also estimated to be the same as they were a year ago, since the last price change to any of the representative items was in Q3 2024, over a year ago.

Bar Chart

Price changes over the last quarter

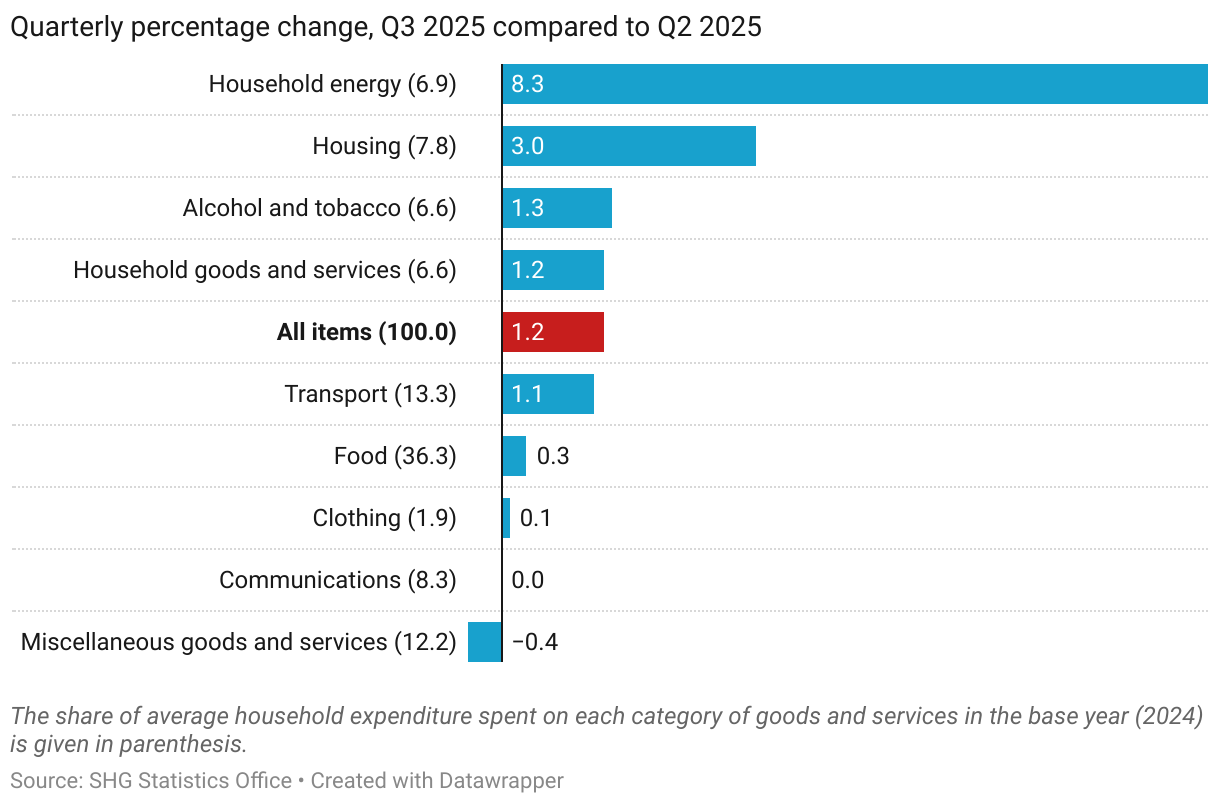
The quarterly change in the CPI was 0.5%, comparing Q4 2025 to Q3 2025. Four categories experienced average increases in prices since the last quarter: Alcohol and Tobacco (3.8%), Miscellaneous Goods and Services (1.3%), Household Goods and Services (0.8%) and Food (0.3%). All other categories remained unchanged apart from clothing which experienced an average price decrease (-0.4%).

Bar Chart

Price changes in the UK and South Africa

Many of the major price changes in 2025 have been related to locally produced products and services. However, changes in both the UK and South Africa usually contribute strongly to the price index on St Helena, since the majority of goods imported are purchased in those two countries. In November 2025 annual consumer price inflation in the UK was measured at 3.2% (UK Office for National Statistics), down from 3.6% in October. In South Africa, annual consumer price inflation was measured at 3.5% in November 2025 (Statistics South Africa), down from 3.6% in November 2025. Changes in the value of the Rand compared to the Pound can have a large effect on the change in the price of goods purchased in South Africa, especially during periods of increase or decrease. During 2025, the Pound averaged 23.6 Rand, which is very similar to the average value for the previous twelve months, which was 23.4, resulting in very little impact on the St Helena inflation rate.

Methodology

Rebasing the Index

The Index was rebased in the third quarter of 2024, following the 2023 Household Expenditure Survey (HES) and subsequent analysis by the Statistics Office. The HES reviewed the composition of the average ‘shopping basket’ of goods and services purchased by households on St Helena, to make sure it reflects current spending habits. The Statistics Office has also reviewed the items that are used to represent each category of spending in the basket, to make sure they are also up to date and relevant. The rebased Index includes 205 categories of expenditure, within nine broader groupings; these broader groupings are unchanged from the previous Index. Within the broad groupings, the detailed categories of expenditure have been adjusted slightly to better align with international guidelines, and in particular they now only include expenditure related to household consumption, and not all expenditures. This has also made a change to the terminology necessary: the Index has been renamed the Consumer Price Index (CPI), rather than the Retail Price Index (RPI).

What is price inflation and how is it measured?

Price inflation is the change in the average prices of goods and services over time. The rate of price inflation is calculated from the change in the CPI, which is the official measure of the average change in the prices of goods and services paid by consumers. The CPI is estimated each quarter, i.e. once every three months, and the rate of price inflation is usually quoted on an annual basis; that is, comparing price changes over a 12-month period. Prices and the CPI tend to go up, but they can occasionally go down – which is known as price deflation.

The CPI is a statistical measure of the change in consumer prices on St Helena; an increase in the CPI means that, on average, prices have gone up since the last time they were measured, and a decrease in the CPI means that, on average, prices have fallen. The annual change in the CPI is called the annual inflation rate, and is the usual measure of the change in prices in an economy. The CPI is an average measure: if it goes up, it does not mean that all prices have gone up, and similarly, if it goes down, it does not mean that all prices have fallen.

Why do we measure inflation?

An accurate measure of price inflation helps understand the extent and nature of the impact of price changes on the government, businesses, households and individuals. Inflation rates are often used in budgeting and accounting processes so that costs can be adjusted for the effect of price changes.

How is the CPI calculated?

The basis for the CPI is the average weekly cost of goods and services purchased by households on St Helena for consumption, sometimes called the CPI ‘shopping basket’. Items which households purchase more of, such as food, have the biggest share of the CPI basket. The current CPI uses a basket from the latest Household Expenditure Survey in 2023; prices representing the groups of items in the basket are collected every quarter, and the price of the total basket is compared to the price in the baseline period, the third quarter of 2024. By convention, the value of the basket in the baseline period is scaled to 100, and the CPI values are quoted in relation to that baseline. For example, a CPI value of 120 means that average prices have increased by 20 per cent compared to those recorded in the baseline period.

What happens when items are not available?

If an item of the ‘basket’ is not available then either the previous price will be carried forward from the previous quarter, or a suitable substitute item will be identified and an adjustment calculation made. Care is taken to ensure that this substitute item represents the item category and that it does not introduce error to the measurement of the CPI. An important principle is that price changes should reflect actual price increases and decreases, and not changes in the quality of items.

Where can I get the data?

For detailed tables of the CPI and annual inflation rates from 1994 onwards, please download the data series in an Excel-formatted spreadheet here: https://www.sainthelena.gov.sh/documents/inflation (if you need other formats, please contact us). Other datasets, bulletins and reports are also available on our website at www.sainthelena.gov.sh/statistics/resources.

Have more questions or comments?

Please get in touch. We are Neil Fantom, Statistical Commissioner, Kelly Clingham and Justine Joshua, Statistics Officers and Courtney O’Dean, Statistics Assistant. You can find us in person at the Statistics Office on the top floor of the Post Office, Jamestown. You can also contact us by telephone on our direct line through 22138. If calling from overseas, the international dialling code for St Helena is +290. Our general office e-mail address is statistics@sainthelena.gov.sh, or you can email team members directly (the format is firstname.lastname@sainthelena.gov.sh).