This update releases new estimates of gross annual incomes of full-time employees (i.e. wages) for the 2023/24 financial year, with comparable estimates for previous years from 2013/14 onwards. To download the full dataset in Excel format, please click here.
These estimates measure gross before-tax incomes of persons in regular full-time employment on St Helena, reported through the Pay-As-You-Earn tax collection system. They exclude company and self-employment incomes, incomes of Technical Cooperation (TC) Officers of the St Helena Government, investment income, Income Related Benefits, incomes from pensions (including the Basic Island Pension), and part-time and part-year incomes, all as far as they can be identified in the dataset. All annual estimates are rounded to the nearest £10.
Median wage levels, adjusted for inflation
The median annual wage on St Helena in 2023/24 is estimated to be £10,490, in 2023/24 prices. When price inflation is taken into account, this is 3.8% higher than the median wage in 2022/23 (Chart 1).
Chart 1. Annual gross wages from full-time employment: median and upper and lower quartiles, 2013/14 to 2023/24 (inflation-adjusted 2023/24 prices)
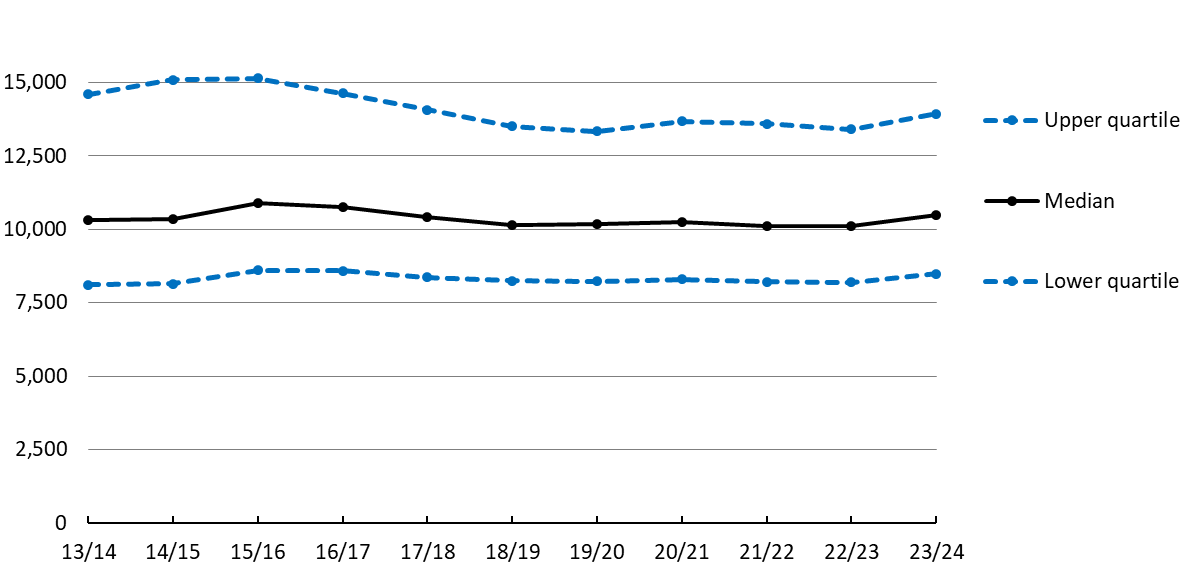
The median is the usual measure of average incomes or wages because it is less sensitive to small numbers of relatively high wage earners in a population than the mean, which is the more common method used in other statistics. A median wage level of £10,490 means that, for 2023/24, half the people earning full-time wages from non-TC employment had gross wages that were less than £10,490, and half had gross wages that were higher.
Wage level range
Chart 1 also shows the upper and lower quartiles; the lower quartile is the point at which a quarter of wages are lower, and the upper quartile is the point at which a quarter of wages are higher; half of all employment wages lie between the lower and upper quartiles. For 2023/24 half of all full-time employees earned between £8,490 and £13,940. The gap between the upper and lower quartiles is smaller in 2023/24 than in 2013/14 and 2014/15, likely the result of a number of relatively higher paid workers leaving the workforce when St Helena’s Airport was completed in 2016 and 2017.
Median incomes are also reported for each decile in the dataset; each decile includes one tenth of all incomes, from the lowest to the highest. It is notable that the median incomes of all deciles increased by at least 3% when inflation is taken into account, apart from the top two deciles (i.e. the highest earners), which both decreased by around 1%.
Differences in wage levels between women and men
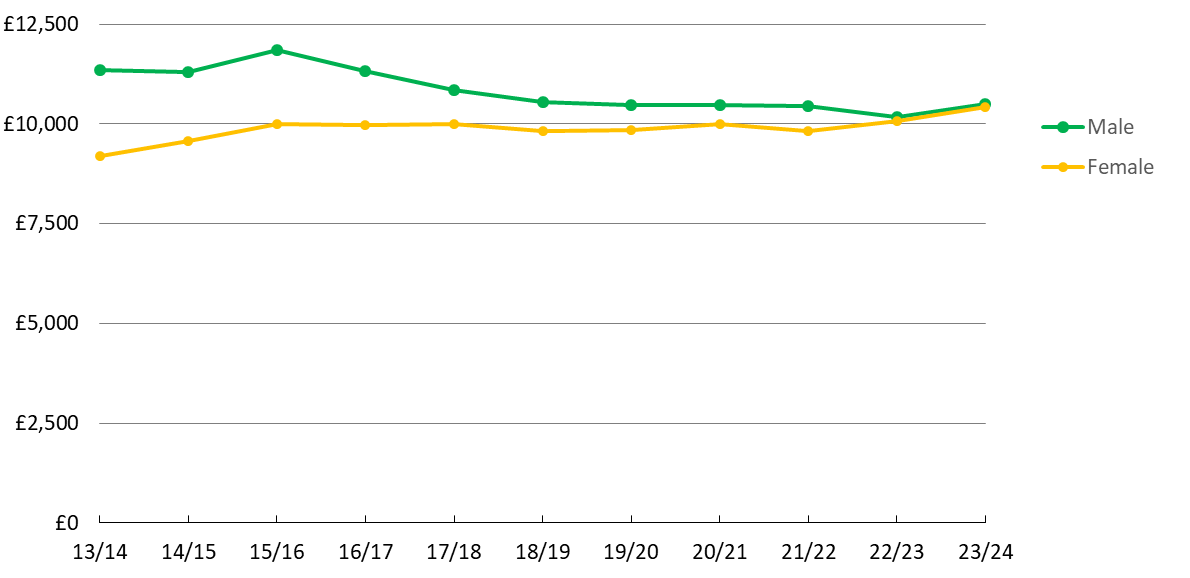
Chart 2 shows inflation-adjusted median wages from employment broken down by male and female employees, between 2013/14 and 2023/24. For every year, the male median wage has been higher than the female median wage, but the gap between the two has narrowed in recent years, and has almost disappeared in 2022/23 and 2023/24. In part this is also due to the completion of the new Airport; construction workers employed were predominantly male, relatively higher paid, and many of them have since either left St Helena or found alternative lower paid employment.
Chart 2. Median real gross annual wages from employment, male and female 2013/14 to 2023/24, in constant 2023/24 prices (i.e. adjusted for inflation)
Average wage levels by occupation
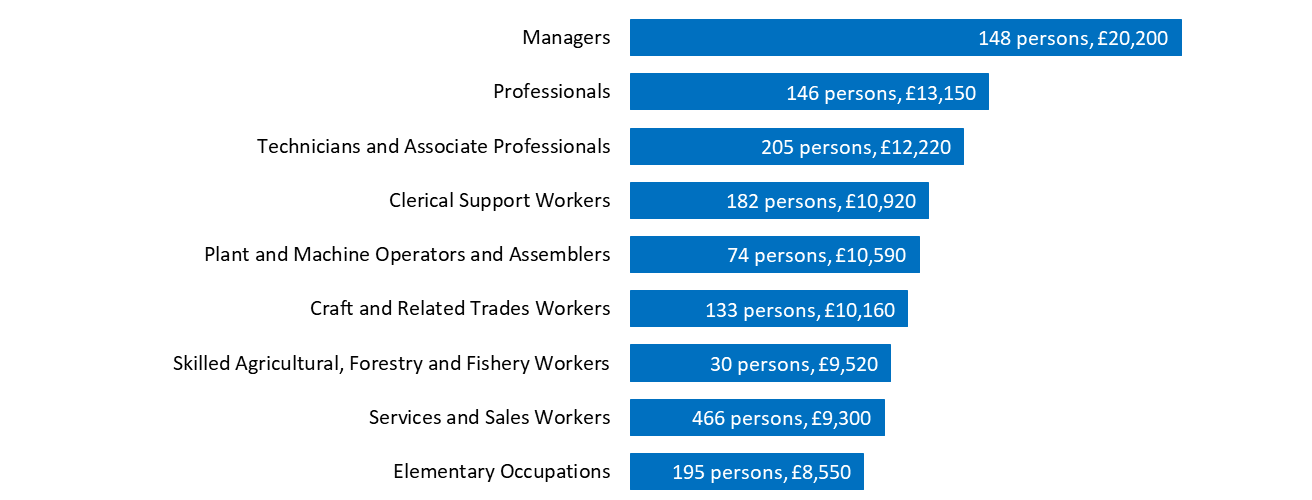
Employees have been classified into their main occupational grouping using the International Standard Classification of Occupations published by the United Nations (International Labour Organisation). Chart 3 shows estimates of median wages in each of these major groupings, for 2023/24, excluding TC Officers and 17 persons that could not be classified by occupation.
The groups of occupations with the highest wages, on average, were Managers, Professionals, and Technicians and Associate Professionals. These groups accounted for 499 employees, or 31% of non-TC employees. The occupations with the lowest wages, on average, were Skilled Agricultural, Forestry and Fishery Workers, Services and Sales Workers, and Elementary Occupations (this group includes unskilled labourers). These groups accounted for 691 employees, or 43% of non-TC Officers.
Chart 3. Median gross annual wages from employment by occupational grouping, 2023/24
Average wage levels by industry
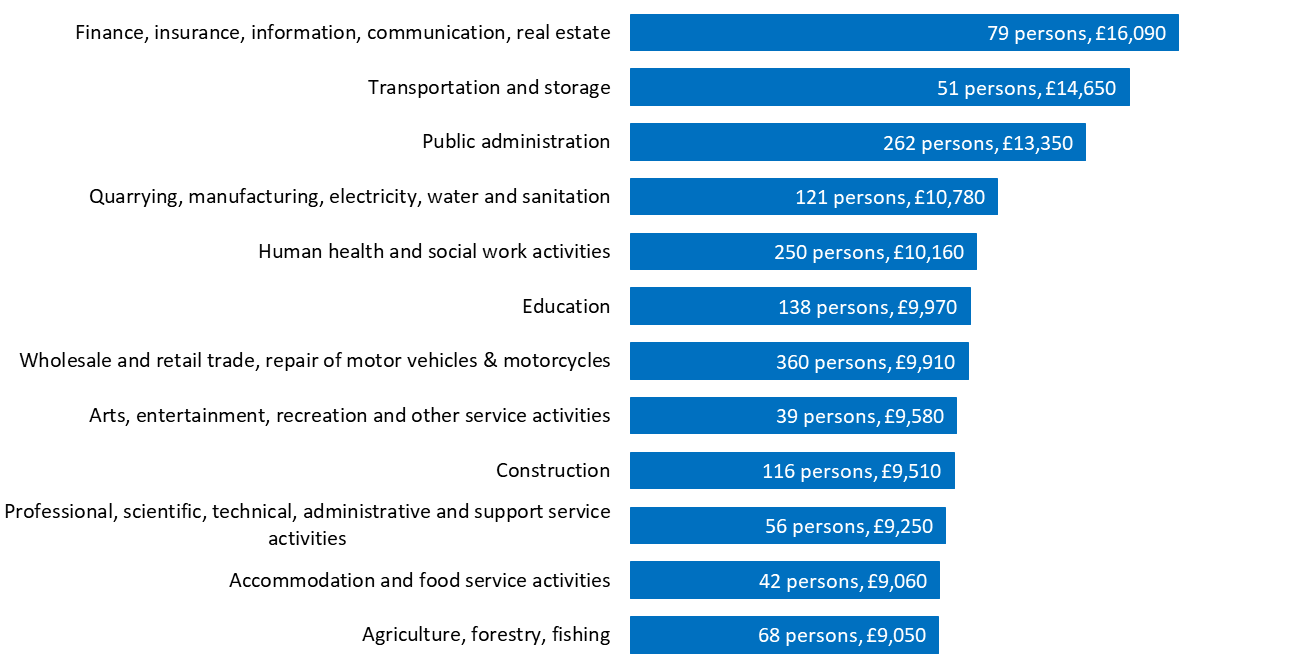
Employees have also been classified into their main industry grouping using the International Standard Industrial Classification published by the United Nations. Industries differ from occupations, since they indicate the principle economic activity to which each employee contributes; mainly, the classification by industry derives from employers. Chart 4 shows estimates of median wages in each major grouping, for non-TC employees, and excluding 14 persons that could not be classified.
In 2023/24 the groups of industries with the highest wages, on average, were Finance, Insurance, Information, Communication and Real Estate, Transportation and Storage, and Public Administration. The industries with the lowest wages, on average, were Professional, Scientific, Technical, Administrative and Support Service Activities, Accommodation and Food Service Activities, and Agriculture, Forestry, and Fishing.
Chart 4. Median gross annual wages from employment by industry, 2023/24
Numbers of persons in full-time employment
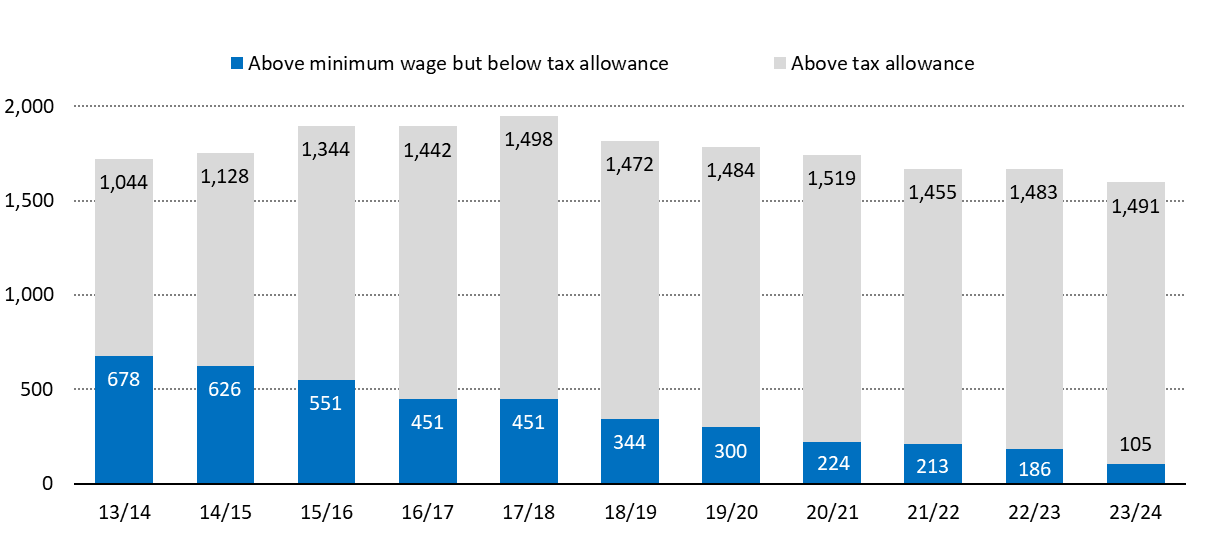
Chart 5 shows the number of persons with wages from full-time employment above and below the income tax allowance, excluding TC officers. Personal income below the income tax allowance is not subject to income tax.
The total estimated number of persons with wages from full-time employment rose to 1,949 in 2017/18, the year when the new airport was opened and most construction activities were completed. Since then, the number has tended to fall slightly each year; in 2021/22, there were an estimated 1,668 persons with wages from full-time employment, and in 2023/24 this is estimated to be 1,596.
Even though the total number of full time employees has declined in the last few years, the number of full-time employees above the income tax allowance of £7,000 increased slightly in 2023/24, to 1,491. The number of people earning more than the minimum wage but not earning enough to pay income tax fell to 105 in 2023/24.
Chart 5. Number of employees in full-time employment, 2013/14 to 2023/24
Methodology, data, and questions or comments
The complete set of statistics on average gross incomes from employment from 2013/14 to 2023/24 is available here in Excel format. For details on how these estimates are computed, please click here. And to contact us with questions, comments, or to request alternative data formats, please click here.