Latest Posts
This update releases new estimates of gross annual incomes of full-time employees (i.e. wages) for the 2023/24 financial year, with comparable estimates for previous years from 2013/14 onwards. To download the full dataset in Excel format, please click here.
These estimates measure gross before-tax incomes of persons in regular full-time employment on St Helena, reported through the Pay-As-You-Earn tax collection system. They exclude company and self-employment incomes, incomes of Technical Cooperation (TC) Officers of the St Helena Government, investment income, Income Related Benefits, incomes from pensions (including the Basic Island Pension), and part-time and part-year incomes, all as far as they can be identified in the dataset. All annual estimates are rounded to the nearest £10.
Median wage levels, adjusted for inflation
The median annual wage on St Helena in 2023/24 is estimated to be £10,490, in 2023/24 prices. When price inflation is taken into account, this is 3.8% higher than the median wage in 2022/23 (Chart 1).
Chart 1. Annual gross wages from full-time employment: median and upper and lower quartiles, 2013/14 to 2023/24 (inflation-adjusted 2023/24 prices)
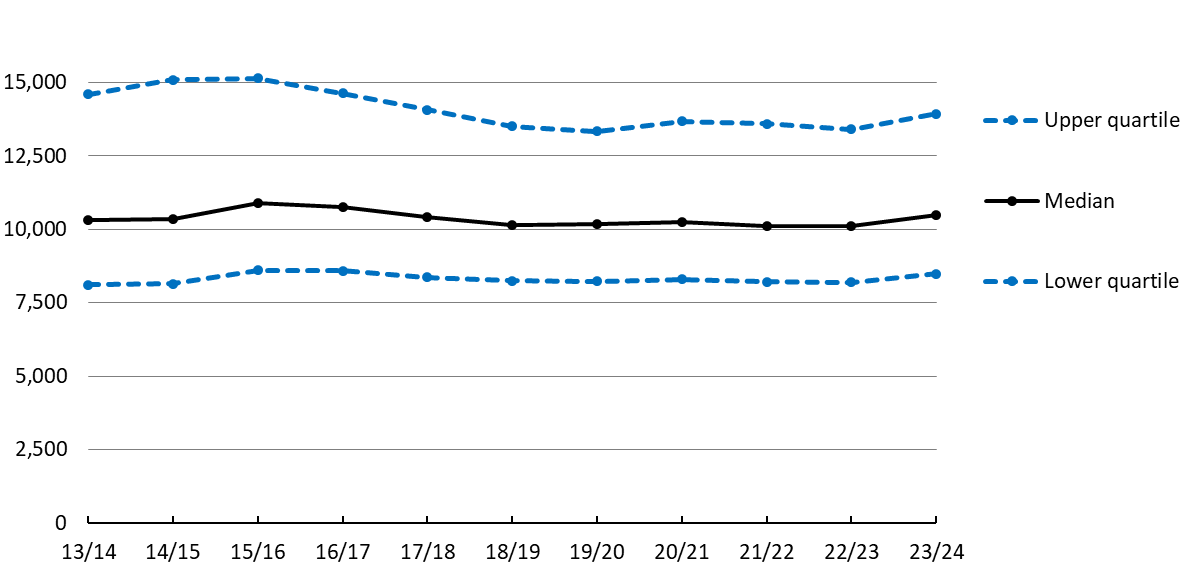
The median is the usual measure of average incomes or wages because it is less sensitive to small numbers of relatively high wage earners in a population than the mean, which is the more common method used in other statistics. A median wage level of £10,490 means that, for 2023/24, half the people earning full-time wages from non-TC employment had gross wages that were less than £10,490, and half had gross wages that were higher.
Wage level range
Chart 1 also shows the upper and lower quartiles; the lower quartile is the point at which a quarter of wages are lower, and the upper quartile is the point at which a quarter of wages are higher; half of all employment wages lie between the lower and upper quartiles. For 2023/24 half of all full-time employees earned between £8,490 and £13,940. The gap between the upper and lower quartiles is smaller in 2023/24 than in 2013/14 and 2014/15, likely the result of a number of relatively higher paid workers leaving the workforce when St Helena’s Airport was completed in 2016 and 2017.
Median incomes are also reported for each decile in the dataset; each decile includes one tenth of all incomes, from the lowest to the highest. It is notable that the median incomes of all deciles increased by at least 3% when inflation is taken into account, apart from the top two deciles (i.e. the highest earners), which both decreased by around 1%.
Differences in wage levels between women and men
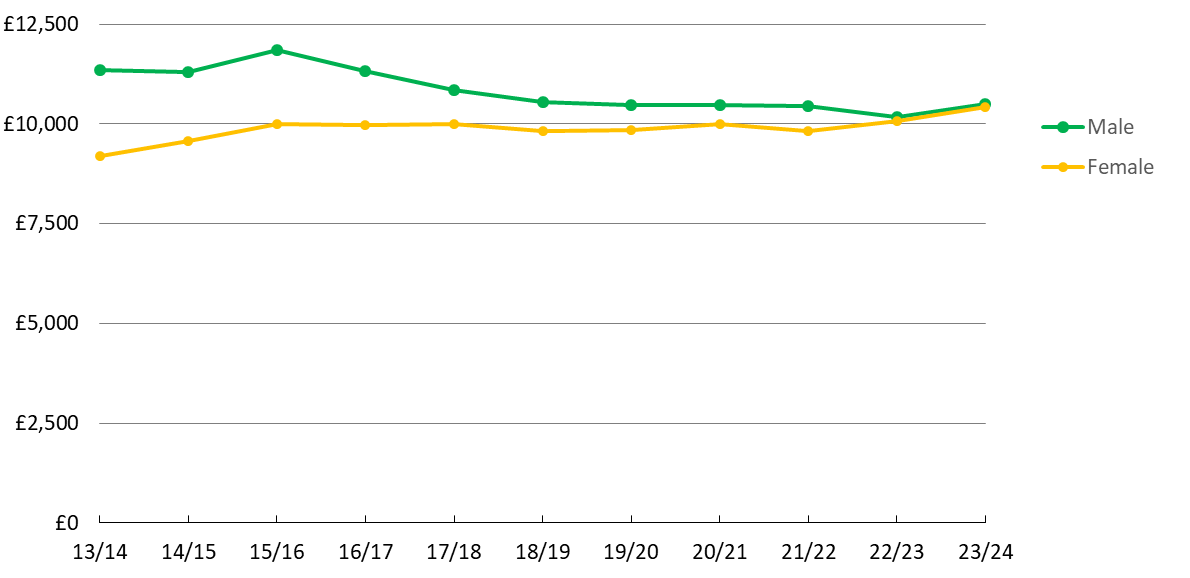
Chart 2 shows inflation-adjusted median wages from employment broken down by male and female employees, between 2013/14 and 2023/24. For every year, the male median wage has been higher than the female median wage, but the gap between the two has narrowed in recent years, and has almost disappeared in 2022/23 and 2023/24. In part this is also due to the completion of the new Airport; construction workers employed were predominantly male, relatively higher paid, and many of them have since either left St Helena or found alternative lower paid employment.
Chart 2. Median real gross annual wages from employment, male and female 2013/14 to 2023/24, in constant 2023/24 prices (i.e. adjusted for inflation)
Average wage levels by occupation
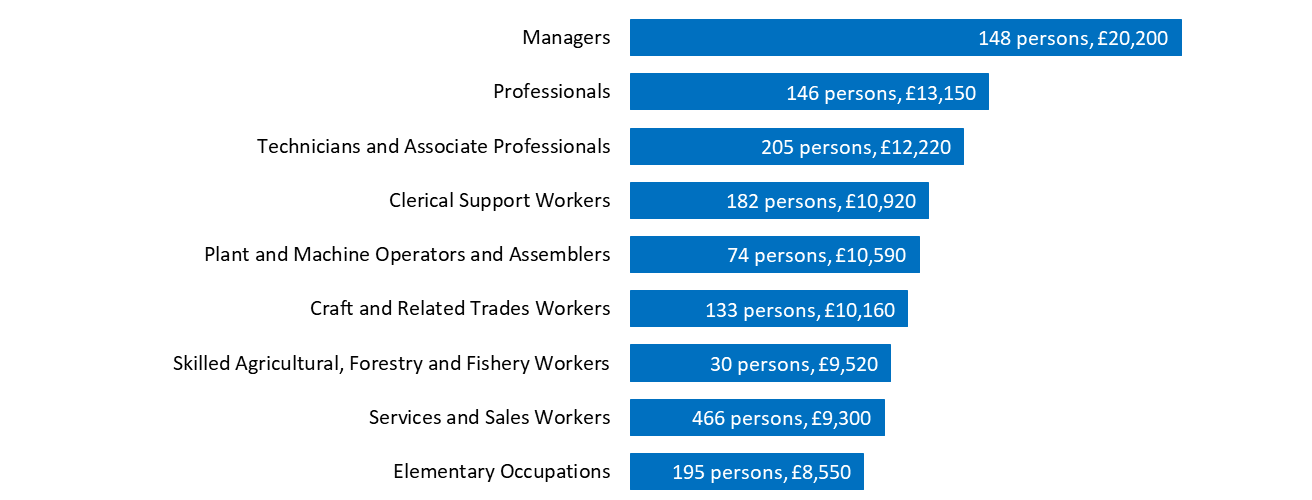
Employees have been classified into their main occupational grouping using the International Standard Classification of Occupations published by the United Nations (International Labour Organisation). Chart 3 shows estimates of median wages in each of these major groupings, for 2023/24, excluding TC Officers and 17 persons that could not be classified by occupation.
The groups of occupations with the highest wages, on average, were Managers, Professionals, and Technicians and Associate Professionals. These groups accounted for 499 employees, or 31% of non-TC employees. The occupations with the lowest wages, on average, were Skilled Agricultural, Forestry and Fishery Workers, Services and Sales Workers, and Elementary Occupations (this group includes unskilled labourers). These groups accounted for 691 employees, or 43% of non-TC Officers.
Chart 3. Median gross annual wages from employment by occupational grouping, 2023/24
Average wage levels by industry
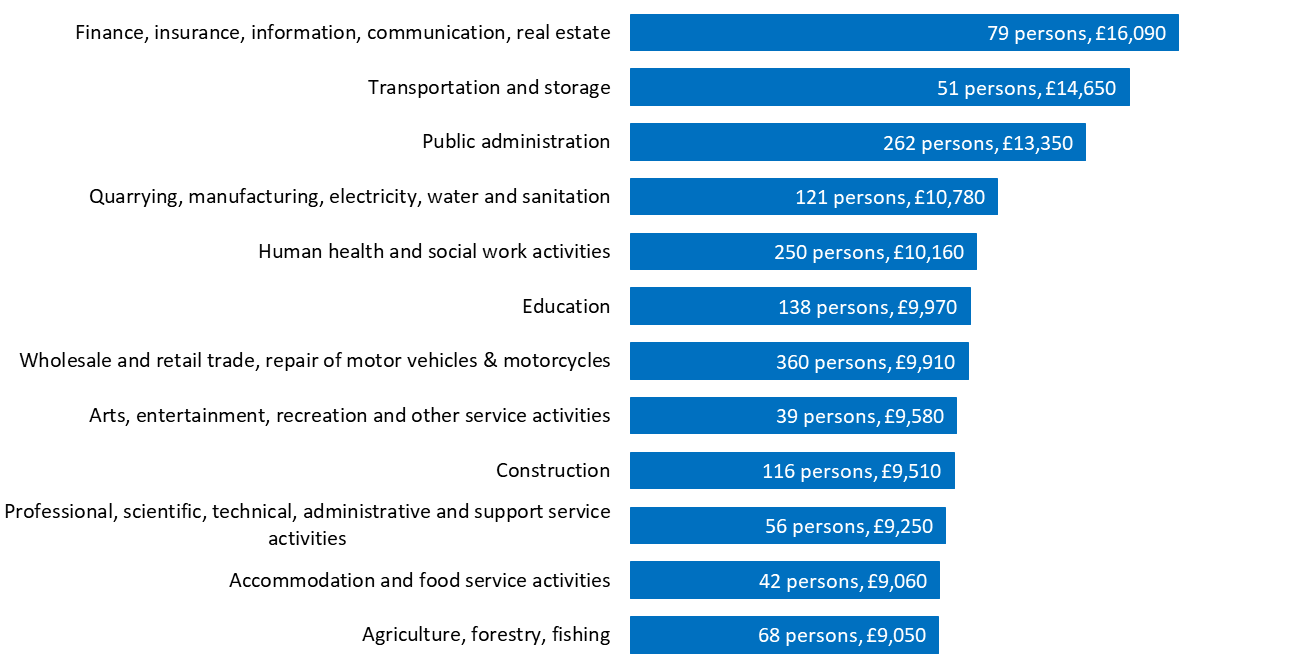
Employees have also been classified into their main industry grouping using the International Standard Industrial Classification published by the United Nations. Industries differ from occupations, since they indicate the principle economic activity to which each employee contributes; mainly, the classification by industry derives from employers. Chart 4 shows estimates of median wages in each major grouping, for non-TC employees, and excluding 14 persons that could not be classified.
In 2023/24 the groups of industries with the highest wages, on average, were Finance, Insurance, Information, Communication and Real Estate, Transportation and Storage, and Public Administration. The industries with the lowest wages, on average, were Professional, Scientific, Technical, Administrative and Support Service Activities, Accommodation and Food Service Activities, and Agriculture, Forestry, and Fishing.
Chart 4. Median gross annual wages from employment by industry, 2023/24
Numbers of persons in full-time employment
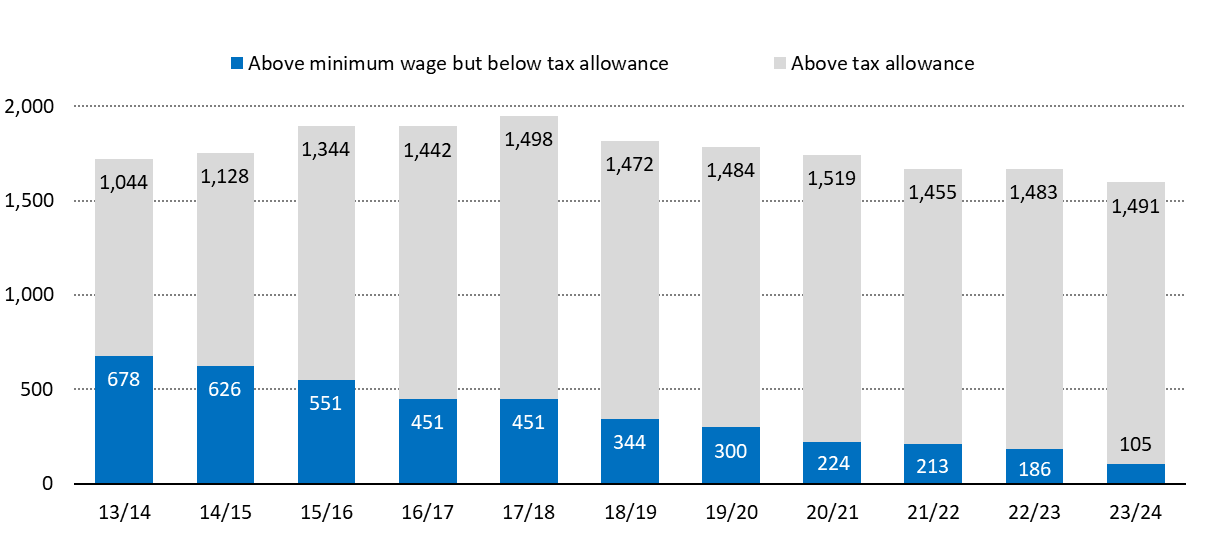
Chart 5 shows the number of persons with wages from full-time employment above and below the income tax allowance, excluding TC officers. Personal income below the income tax allowance is not subject to income tax.
The total estimated number of persons with wages from full-time employment rose to 1,949 in 2017/18, the year when the new airport was opened and most construction activities were completed. Since then, the number has tended to fall slightly each year; in 2021/22, there were an estimated 1,668 persons with wages from full-time employment, and in 2023/24 this is estimated to be 1,596.
Even though the total number of full time employees has declined in the last few years, the number of full-time employees above the income tax allowance of £7,000 increased slightly in 2023/24, to 1,491. The number of people earning more than the minimum wage but not earning enough to pay income tax fell to 105 in 2023/24.
Chart 5. Number of employees in full-time employment, 2013/14 to 2023/24
Methodology, data, and questions or comments
The complete set of statistics on average gross incomes from employment from 2013/14 to 2023/24 is available here in Excel format. For details on how these estimates are computed, please click here. And to contact us with questions, comments, or to request alternative data formats, please click here.
The latest provisional estimates have been released for the numbers of passenger arrivals and departures to and from St Helena, up to the end of February 2025.
Note: Estimates of the arrivals of St Helenians and those arriving for leisure are not yet available for November 2024 onwards, due to a change in immigration arrival procedures.
Arrivals
In February 2025, there were an estimated 656 arrivals, with 480 arriving by air; this compares with 458 arrivals in February 2024, with 343 arriving by air. During the last 12 months (March 2024 to February 2025) there have been 4,774 arrivals, compared to 4,426 in the same period a year ago – a 7.9% increase.
Departures
In February 2025 there were an estimated 663 departures from the island, 7 more than the number of arrivals. During the last 12 months (March 2024 to February 2025), there were a total of 4,779 departures, compared to 4,451 in the same period a year ago – an increase of 7.4%.
Get the data
A file in Excel format with detailed monthly statistics on arrivals and departures can be downloaded here.
Latest index value and inflation rates for Q1 2025
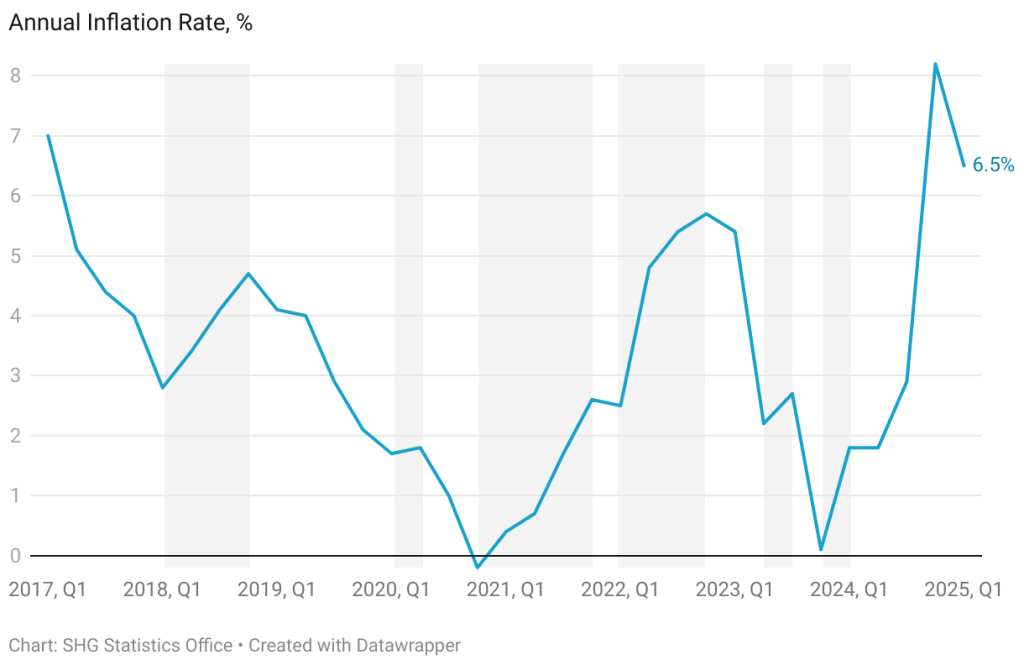
The latest estimate of the Consumer Price Index (CPI) has been released by the St Helena Statistics Office, for the first quarter of 2025 (Q1 2025). The CPI has been measured at 103.5, a small increase of 0.4% on the previous quarter (Q4 2024) but a 6.5% increase compared to a year ago (Q1 2024). This annual inflation rate of 6.5% is a drop in the rate of 1.7 percentage points compared to the rate measured in Q4 2024, which was 8.2%.
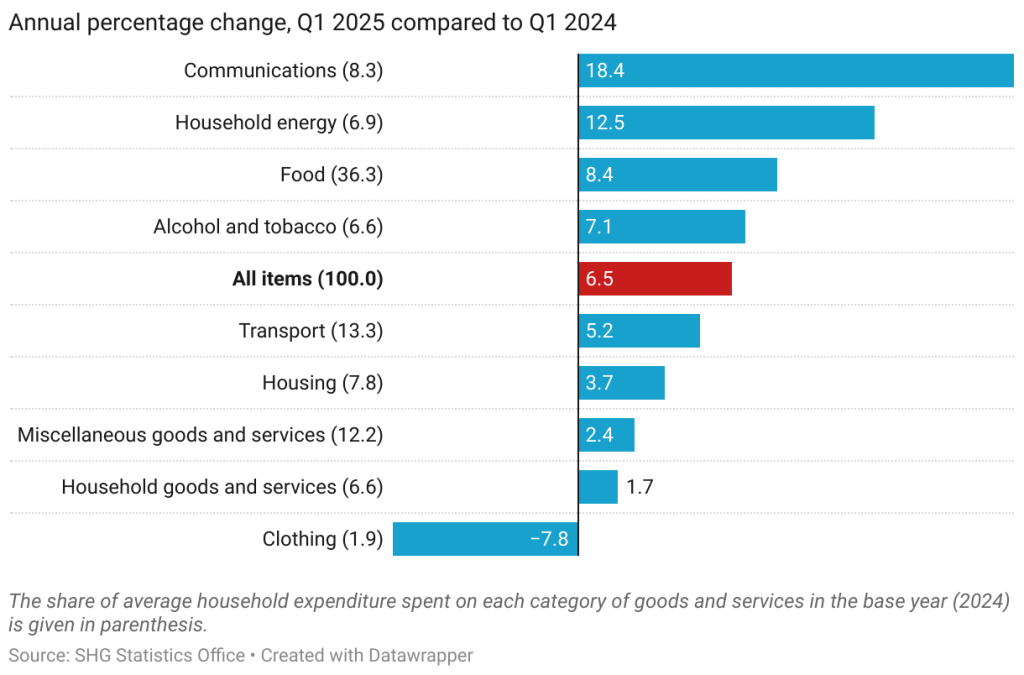
Price changes over the last year
On average, all broad groups of items saw their prices rise compared to a year ago, except for clothing. The highest average annual increase was in Communication (18.4%), resulting from increases in July 2024 in the landline telephone tariff and mobile data packages. There was an average annual increase in Household Energy of 12.5%, lower than in the previous quarter (28.1%) and the result of the increase in the price of electricity in July 2024. The average annual increase in Food prices was 8.4%, which was also slightly lower than the annual increase measured last quarter (9.7%), and still includes the increase in the price of locally produced bread and meat implemented by Solomons in Q4 2024. Transport costs increased by 5.2% on average over the year, partly because of the increase in the price of the public transport service in December 2024.
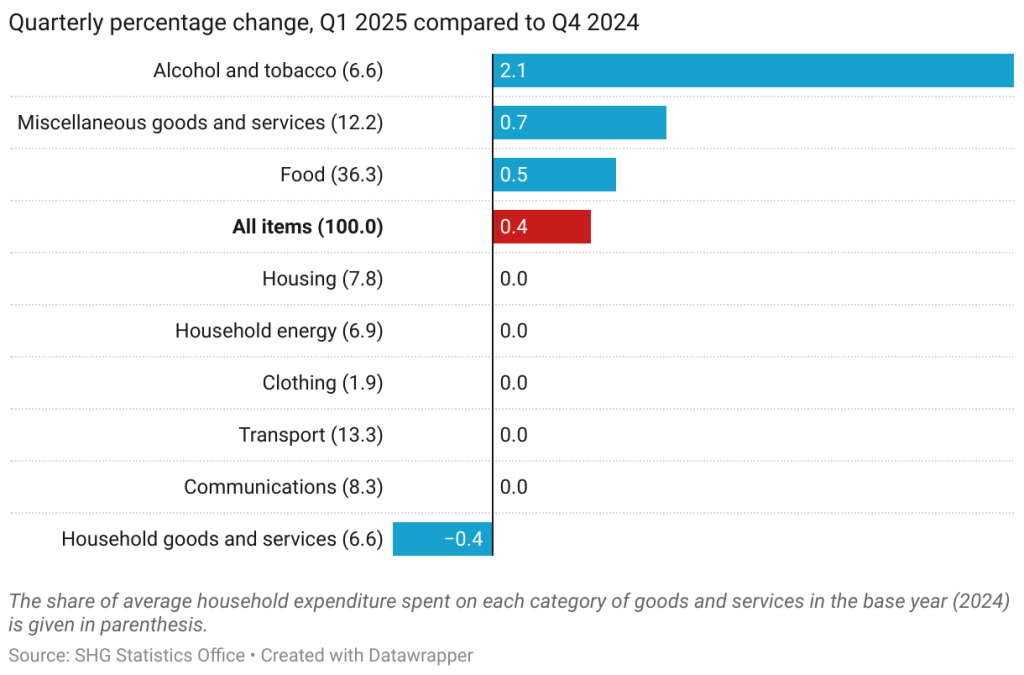
Price changes over the last quarter
The quarterly change in the CPI was 0.4%, comparing Q1 2025 to Q4 2024. Only three groups of categories experienced average increases since the last quarter: Alcohol & Tobacco, 2.1%; Miscellaneous Good & Services, 0.7%; and Food, 0.5%. Household Goods and Services fell slightly (-0.4%), with all other catergories being unchanged on average.
Note that normally price changes in both the UK and South Africa have a strong impact on prices on St Helena, since the majority of goods imported are purchased in those two countries (although for the Q4 2024 Index, price increases in local goods and services had a major effect). In March 2025 annual consumer price inflation in the UK was measured at 2.6% (UK Office for National Statistics), down from 2.8% in February. In South Africa, annual consumer price inflation was measured at 3.2% in February 2025 (Statistics South Africa), unchanged from January 2025. Changes in the value of the Rand compared to the Pound can have a large effect on the change in the price of goods purchased in South Africa, especially during periods of increase or decrease. However, for the period April 2024 to March 2025, the Pound averaged 23.3 Rand, which is very similar to the average value for the previous twelve months, which was 23.5, and so had no major impact on the St Helena inflation rate.
Methodology
Rebasing the Index
The Index was rebased in the third quarter of 2024, following the 2023 Household Expenditure Survey (HES) and subsequent analysis by the Statistics Office. The HES reviewed the composition of the average ‘shopping basket’ of goods and services purchased by households on St Helena, to make sure it reflects current spending habits. The Statistics Office has also reviewed the items that are used to represent each category of spending in the basket, to make sure they are also up to date and relevant. The rebased Index includes 205 categories of expenditure, within nine broader groupings; these broader groupings are unchanged from the previous Index. Within the broad groupings, the detailed categories of expenditure have been adjusted slightly to better align with international guidelines, and in particular they now only include expenditure related to household consumption, and not all expenditures. This has also made a change to the terminology necessary: the Index has been renamed the Consumer Price Index (CPI), rather than the Retail Price Index (RPI).
What is price inflation and how is it measured?
Price inflation is the change in the average prices of goods and services over time. The rate of price inflation is calculated from the change in the CPI, which is the official measure of the average change in the prices of goods and services paid by consumers. The CPI is estimated each quarter, i.e. once every three months, and the rate of price inflation is usually quoted on an annual basis; that is, comparing price changes over a 12-month period. Prices and the CPI tend to go up, but they can occasionally go down – which is known as price deflation.
The CPI is a statistical measure of the change in consumer prices on St Helena; an increase in the CPI means that, on average, prices have gone up since the last time they were measured, and a decrease in the CPI means that, on average, prices have fallen. The annual change in the CPI is called the annual inflation rate, and is the usual measure of the change in prices in an economy. The CPI is an average measure: if it goes up, it does not mean that all prices have gone up, and similarly, if it goes down, it does not mean that all prices have fallen.
Why do we measure inflation?
An accurate measure of price inflation helps understand the extent and nature of the impact of price changes on the government, businesses, households and individuals. Inflation rates are often used in budgeting and accounting processes so that costs can be adjusted for the effect of price changes.
How is the CPI calculated?
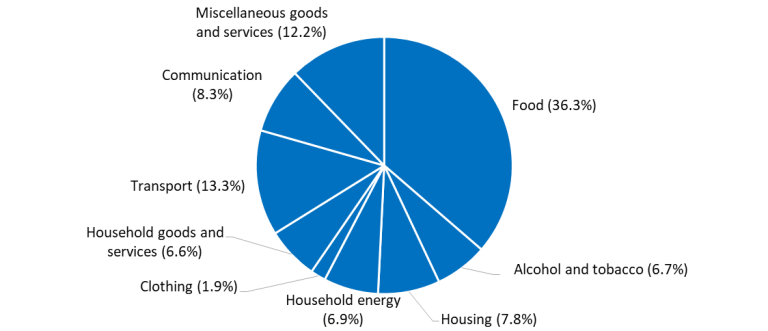
The basis for the CPI is the average weekly cost of goods and services purchased by households on St Helena for consumption, sometimes called the CPI ‘shopping basket’. Items which households purchase more of, such as food, have the biggest share of the CPI basket. The current CPI uses a basket from the latest Household Expenditure Survey in 2023; prices representing the groups of items in the basket are collected every quarter, and the price of the total basket is compared to the price in the baseline period, the third quarter of 2024. By convention, the value of the basket in the baseline period is scaled to 100, and the CPI values are quoted in relation to that baseline. For example, a CPI value of 120 means that average prices have increased by 20 per cent compared to those recorded in the baseline period.
Composition of average household weekly expenditure (Q3 2024 CPI ‘Shopping Basket’)
What happens when items are not available?
If an item of the ‘basket’ is not available then either the previous price will be carried forward from the previous quarter, or a suitable substitute item will be identified and an adjustment calculation made. Care is taken to ensure that this substitute item represents the item category and that it does not introduce error to the measurement of the CPI. An important principle is that price changes should reflect actual price increases and decreases, and not changes in the quality of items.
Where can I get the data?
For detailed tables of the CPI and annual inflation rates from 1994 onwards, please visit: https://www.sainthelena.gov.sh/st-helena/statistics/the-economy and download the ‘inflation’ data file. Other datasets, bulletins and reports are also available on our website at www.sainthelena.gov.sh/statistics.
Have more questions or comments?
Please get in touch. We are Neil Fantom, Statistical Commissioner, Kelly Clingham and Justine Joshua, Senior Statistical Assistants and Courtney O’Dean, Statistics Assistant. You can find us in person at the Statistics Office on the top floor of the Post Office, Jamestown. You can also contact us by telephone on our direct line through 22138. If calling from overseas, the international dialling code for St Helena is +290. Our general office e-mail address is statistics@sainthelena.gov.sh, or you can email team members directly (the format is firstname.lastname@sainthelena.gov.sh).
The latest provisional estimates have been released for the numbers of passenger arrivals and departures to and from St Helena, up to the end of January 2025.
Note: this release was updated on April 15 2025; estimates of the arrivals of St Helenians and those arriving for leisure are not yet available for November 2024 onwards, due to a change in immigration arrival procedures.
Arrivals
In January 2025, there were an estimated 756 arrivals, with 519 arriving by air; this compares with 625 arrivals in January 2024, with 449 arriving by air. During the last 12 months (February 2024 to January 2025) there have been 4,576 arrivals, compared to 4,361 in the same period a year ago – a 4.9% increase.
Departures
In January 2025 there were an estimated 974 departures from the island, 218 more than the number of arrivals. During the last 12 months (February 2024 to January 2025), there were a total of 4,623 departures, compared to 4,385 in the same period a year ago – an increase of 5.4%.
Get the data
A file in Excel format with detailed monthly statistics on arrivals and departures can be downloaded here.
Latest index value and inflation rates for Q4 2024
The Statistics Office has released new estimates of the Consumer Price Index (CPI) and the annual inflation rate. For the fourth quarter of 2024 the CPI has been measured at 103.1; in Q4 2023 the CPI was 95.3, which results in an annual inflation rate of 8.2%. This is much higher than the annual rate for Q3 2024 (which was 2.9%), and is the highest annual rate since 2009.
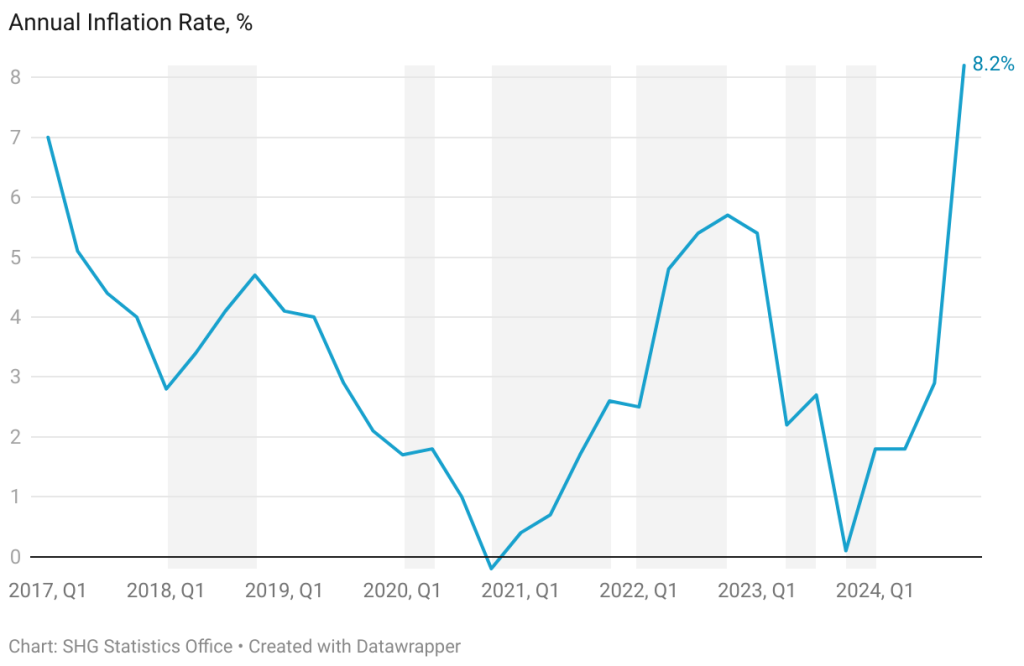
Note that the index has been ‘rebased’ to 100 in Q3, 2024, and there has been a terminology change to Consumer Price Index (from the previous term Retail Price Index) as a result of a slight change in the index composition to make it more internationally consistent.
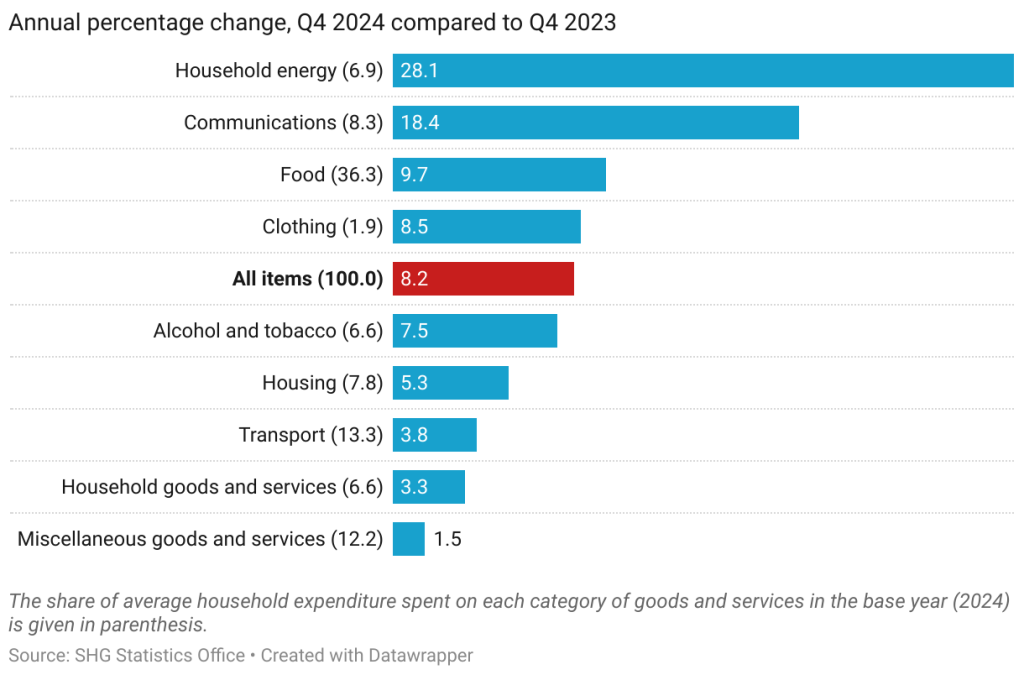
Price changes over the last year
On average, all broad groups of items saw their prices rise compared to a year ago. Some of the most significant changes were increases in electricity prices in January and July, increases in the price of telephone tariff and mobile data packages in July, and increases in the price of bread, local meat, and public transport in December. Additionally, the substantial drop in the price of broadband internet and mobile phone data packages in October 2023 is now no longer affecting the annual price inflation rate. This has resulted in an annual average price increases of 28.1% in Household Energy, 18.4% in Communications, and 9.7% in Food – the annual increase in average Food prices is the highest since Q2, 2017.
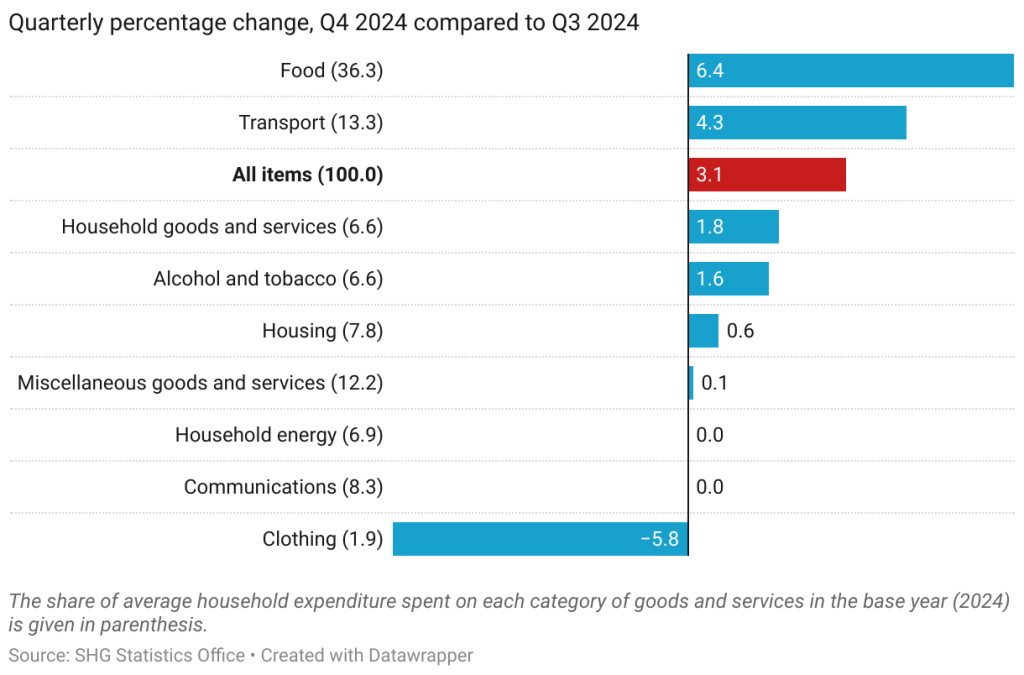
Price changes over the last quarter
The quarterly change in the CPI was 3.1%, comparing Q4 2024 to Q3 2024. All groups of categories experienced average increases since the last quarter, apart from the Clothing, Communications, and Household Energy groups (due to their nature, clothing items tend to change frequently, depending on stock and demand). The groups with the highest quarterly increases were Food (6.4%) and Transport (4.3%), the consequence of an increase in the prices of goods and services, especially bread, meat, and the public bus service.
Note that normally price changes in both the UK and South Africa have a strong impact on prices on St Helena, since the majority of goods imported are purchased in those two countries, although for the Q4 2024 Index, price increases in local goods and services have had a major effect. In December 2024, annual consumer price inflation in the UK was measured at 2.5% (UK Office for National Statistics), down from 2.6% in November. In South Africa, annual consumer price inflation was measured at 3.0% in December 2024 (Statistics South Africa), up from 2.9% in November 2024. Changes in the value of the Rand compared to the Pound can have a large effect on the price of goods purchased in South Africa. For example, for the period January to December 2024, the Pound averaged 23.4 Rand, which is a 2.1% increase compared to the same period in 2023, when it was 23.0. This change tends to counteract the effect of price inflation in South Africa on final shop-floor prices on St Helena.
Methodology
Rebasing the Index
The Index was rebased in the third quarter of 2024, following the 2023 Household Expenditure Survey (HES) and subsequent analysis by the Statistics Office. The HES reviewed the composition of the average ‘shopping basket’ of goods and services purchased by households on St Helena, to make sure it reflects current spending habits. The Statistics Office has also reviewed the items that are used to represent each category of spending in the basket, to make sure they are also up to date and relevant. The rebased Index includes 205 categories of expenditure, within nine broader groupings; these broader groupings are unchanged from the previous Index. Within the broad groupings, the detailed categories of expenditure have been adjusted slightly to better align with international guidelines, and in particular they now only include expenditure related to household consumption, and not all expenditures. This has also made a change to the terminology necessary: the Index has been renamed the Consumer Price Index (CPI), rather than the Retail Price Index (RPI).
What is price inflation and how is it measured?
Price inflation is the change in the average prices of goods and services over time. The rate of price inflation is calculated from the change in the CPI, which is the official measure of the average change in the prices of goods and services paid by consumers. The CPI is estimated each quarter, i.e. once every three months, and the rate of price inflation is usually quoted on an annual basis; that is, comparing price changes over a 12-month period. Prices and the CPI tend to go up, but they can occasionally go down – which is known as price deflation.
The CPI is a statistical measure of the change in consumer prices on St Helena; an increase in the CPI means that, on average, prices have gone up since the last time they were measured, and a decrease in the CPI means that, on average, prices have fallen. The annual change in the CPI is called the annual inflation rate, and is the usual measure of the change in prices in an economy. The CPI is an average measure: if it goes up, it does not mean that all prices have gone up, and similarly, if it goes down, it does not mean that all prices have fallen.
Why do we measure inflation?
An accurate measure of price inflation helps understand the extent and nature of the impact of price changes on the government, businesses, households and individuals. Inflation rates are often used in budgeting and accounting processes so that costs can be adjusted for the effect of price changes.
How is the CPI calculated?
The basis for the CPI is the average weekly cost of goods and services purchased by households on St Helena for consumption, sometimes called the CPI ‘shopping basket’. Items which households purchase more of, such as food, have the biggest share of the CPI basket. The current CPI uses a basket from the latest Household Expenditure Survey in 2023; prices representing the groups of items in the basket are collected every quarter, and the price of the total basket is compared to the price in the baseline period, the third quarter of 2024. By convention, the value of the basket in the baseline period is scaled to 100, and the CPI values are quoted in relation to that baseline. For example, a CPI value of 120 means that average prices have increased by 20 per cent compared to those recorded in the baseline period.
Composition of average household weekly expenditure (Q3 2024 CPI ‘Shopping Basket’)

What happens when items are not available?
If an item of the ‘basket’ is not available then either the previous price will be carried forward from the previous quarter, or a suitable substitute item will be identified and an adjustment calculation made. Care is taken to ensure that this substitute item represents the item category and that it does not introduce error to the measurement of the CPI. An important principle is that price changes should reflect actual price increases and decreases, and not changes in the quality of items.
Where can I get the data?
For detailed tables of the CPI and annual inflation rates from 1994 onwards, please visit: https://www.sainthelena.gov.sh/st-helena/statistics/the-economy and download the ‘inflation’ data file. Other datasets, bulletins and reports are also available on our website: www.sainthelena.gov.sh/statistics.
Have more questions or comments?
Please get in touch. We are Neil Fantom, Statistical Commissioner, Kelly Clingham and Justine Joshua, Senior Statistical Assistants and Courtney O’Dean, Statistics Assistant. You can find us in person at the Statistics Office on the top floor of the Post Office, Jamestown. You can also contact us by telephone on our direct line through 22138. If calling from overseas, the international dialling code for St Helena is +290. Our general office e-mail address is statistics@sainthelena.gov.sh, or you can email team members directly (the format is firstname.lastname@sainthelena.gov.sh).
The latest provisional estimates have been released for the numbers of passenger arrivals and departures to and from St Helena, up to the end of November, 2024.
Note: this release was updated on April 15 2025; estimates of the arrivals of St Helenians and those arriving for leisure are not yet available for November 2024 onwards, due to a change in immigration arrival procedures.
Arrivals
In November 2024, there were an estimated 421 arrivals, with 373 arriving by air; this compares with 332 arrivals in November 2023, with 315 arriving by air. During the last 12 months (December 2023 to November 2024) there have been 4,365 arrivals, compared to 4,196 in the same period a year ago – a 4.0% increase.
Departures
In November 2024 there were an estimated 319 departures from the island, 102 less than the number of arrivals. During the last 12 months (December 2023 to November 2024), there were a total of 4,328 departures, compared to 4,195 in the same period a year ago – a increase of 3.2%.
The latest provisional estimates have been released for the numbers of passenger arrivals and departures to and from St Helena, up to the end of October, 2024.
Arrivals
In October 2024, there were an estimated 330 arrivals, with 300 arriving by air; this compares with 289 arrivals in October 2023, with 220 arriving by air. 149 people arrived for leisure, including 91 non-St Helenians and 58 St Helenians visiting family and friends on the island. During the last 12 months (November 2023 to October 2024) there have been 4,279 arrivals, compared to 4,224 in the same period a year ago – a 1.3% increase. Of those arrivals, 1,983 were for a leisure purpose, this is 4.8% more than the same period in the previous year, when arrivals for leisure purposes totalled 1,893. There were 889 tourists (i.e. non-St Helenian leisure visitors), a 3.7% increase compared the previous twelve month period, when there were 857.
Departures
In October 2024 there were an estimated 252 departures from the island, 78 less than the number of arrivals. During the last 12 months (November 2023 to October 2024), there were a total of 4,230 departures, compared to 4,298 in the same period a year ago – a decrease of 1.6%.
Get the data
A file in Excel format with detailed monthly statistics on arrivals and departures to October 2024 can be downloaded here.
The St Helena Statistics Office has released new provisional estimates of the number of people on St Helena by age, sex, residency and nationality, and the number of births and deaths, up to the end of October 2024.
At the end of October 2024 there were an estimated 4,200 people on the island, an increase of 72 from the end of September, when there were an estimated 4,128. Of the people on the island, an estimated 4,058 people were residents, and 142 were visitors. This compares to an estimated 4,017 residents on the island at the end of September, and 4,078 residents on the island a year ago, at the end of October 2023.
Compared to a year ago, at the end of October 2023, there has been a decrease in the number of resident children on-island (0-14 years) from 534 to 518, and a decrease in those of roughly working age (15-64 years) from 2,415 to 2,373. But the number of people aged 65 and over increased, from 1,129 to 1,167. The Old Aged Dependency Ratio of the resident on-island population (the number of those 65 and over compared to those of roughly working age) was 49.2 at the end of October 2024. The age group with the smallest number of St Helenians is 0-4 (120), followed closely by 20-24 (128); the age groups with the most is 55-59 and 60-64, both with 340 people.
A data file with monthly population estimates to the end of October 2024 can be downloaded here. The file includes population totals by age, sex, residency and nationality, and the number of arrivals, departures, births, and deaths.
The St Helena Statistics Office has released new provisional estimates of the number of people on St Helena by age, sex, residency and nationality, and the number of births and deaths.
At the end of September 2024 there were an estimated 4,128 people on the island, an increase of 82 from the end of August, when there were an estimated 4,046. Of the people on the island, an estimated 4,023 people were residents, and 105 were visitors. This compares to an estimated 3,935 residents on the island at the end of August, and 4,077 residents on the island a year ago, at the end of September 2023.
Compared to a year ago at the end of September 2023 there has been a decrease in the number of resident children on-island (0-14 years) and those of roughly working age (15-64 years), by 18 and 57 respectively, but an increase of the number of those 65 and over, by 21. As a result the Old Aged Dependency Ratio of the resident on-island population (the number of those 65 and over compared to those of roughly working age) has increased to 48.6 at the end of September 2024, compared to September 2023 when it was estimated to be 46.5.
The chart illustrates the estimated St Helenian resident population at the end of September 2024 by five-year age groups and sex. The age group with the smallest number of St Helenians is 20-24 (117), followed closely by 0-4 (118); the age group with the most is 60-64, with 339 people.
A data file with monthly population estimates to the end of September 2024 can be downloaded here. The file includes population totals by age, sex, residency and nationality, and the number of arrivals, departures, births, and deaths.
The latest provisional estimates have been released for the numbers of passenger arrivals and departures to and from St Helena.
Arrivals
In September 2024, there were an estimated 315 arrivals, with 310 arriving by air. 73 people arrived for leisure, including 27 non-St Helenians and 46 St Helenians visiting family and friends on the island. 5 people arrived by yacht or ship. During the last 12 months (October 2023 to September 2024) there have been 4,238 arrivals, compared to 4,170 in the same period a year ago – a 1.6% increase. Of those arrivals, 1,911 were for a leisure purpose, this is 0.7% more than the same period in the previous year when arrivals for leisure purposes totalled 1,898.
Departures
In September 2024 there were an estimated 231 departures from the island, 84 less than the number of arrivals. 223 left by air with the remaining 8 leaving by sea. During the last 12 months (October 2023 to September 2024), there were a total of 4,280 departures, compared to 4,225 in the same period a year ago – an increase of 1.3%, and 42 more than the number of arrivals.
Get the data
A file in Excel format with detailed monthly statistics on arrivals and departures can be downloaded here.