8 October 2018
This bulletin includes estimates of the latest annual price inflation rates for the third quarter of 2018, calculated from the Retail Price Index (RPI). The data released in this Bulletin, including the RPI itself, can be downloaded from the St Helena Statistics website at: www.sainthelena.gov.sh/statistics-data. Detailed data can be accessed in Excel format here. The pdf version of the full Bulletin can be found here.
Average inflation rate
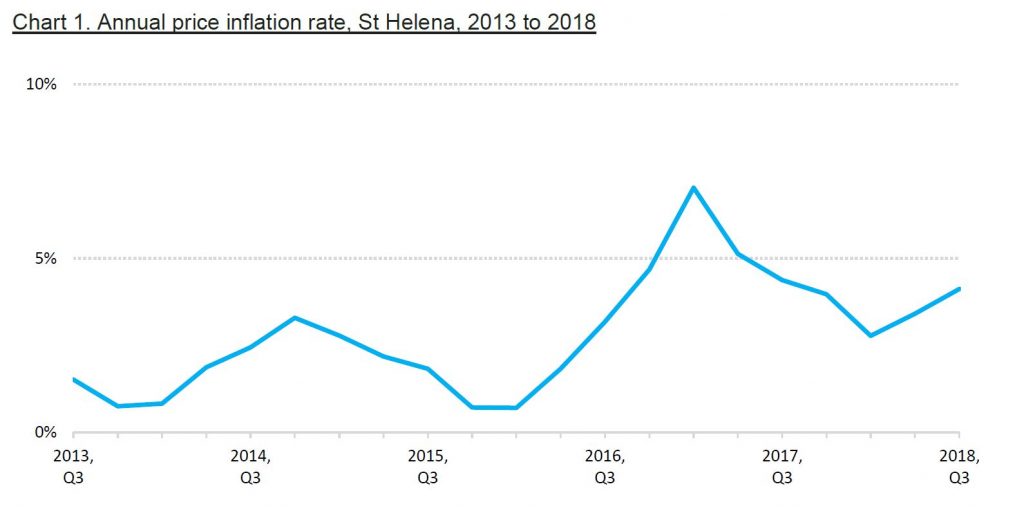
The latest rate of annual price inflation is estimated to be 4.1%, between the third quarter of 2018 and the third quarter of 2017. This is a 0.7 percentage point increase from the previous quarter, when the annual price inflation rate was measured at 3.4% (Chart 1).
Contributing factors
The two price changes with the most impact this quarter were the increases in the price of water from Connect, and the increase in the local telephone service provided by Sure. There were some other notable price increases, such as flour and soft drinks, but the price of some imported fruit, for example apples and oranges, fell – this is consistent with a reduction in the import duty from 20% to 5% for all fruit and vegetables without added salt or sugar.
There are more than 200 items in the RPI ‘basket’, but some 70% were unchanged in price from the previous quarter. While increases in freight rates for the MV Helena will tend to increase the price of imported goods, the depreciation of the Rand compared to the St Helena Pound over the year (of just over 5%) has the opposite effect, by decreasing their price. The ability of the MV Helena to transport more weight per container may also have helped mitigate the price increases in freight. The prices of goods imported from South Africa and the United Kingdom are also affected by inflation in those economies; in August, annual inflation was 4.9% in South Africa and 2.7% in the UK.
Inflation rates of RPI categories
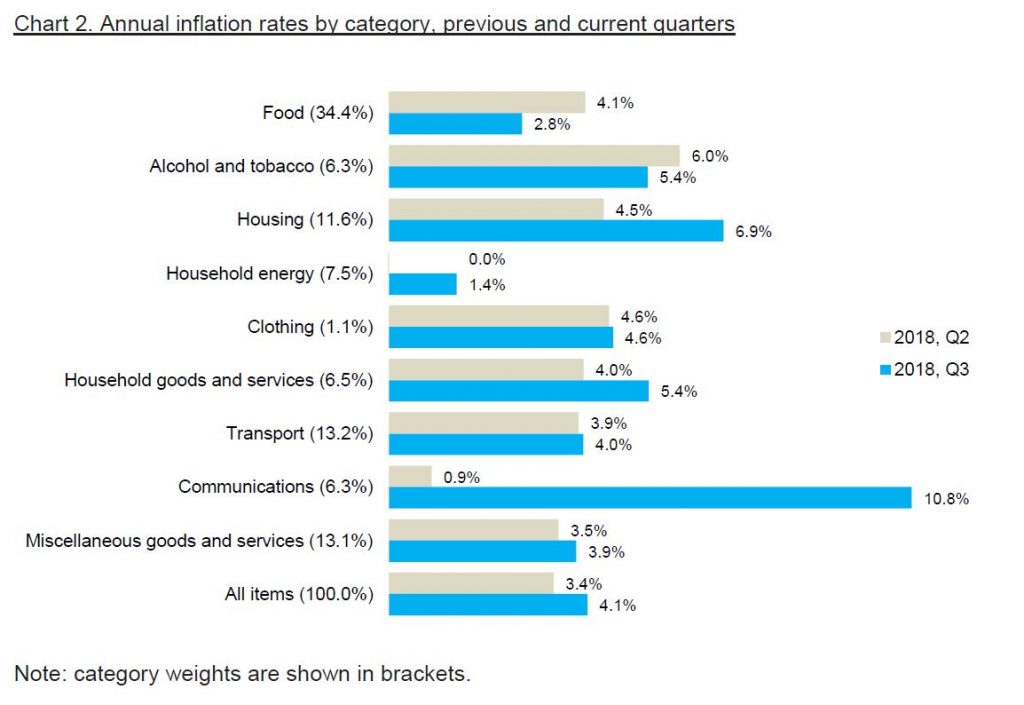
Average prices for all the categories of the RPI increased compared to the year before (Chart 2) – in other words, inflation rates were all positive. Categories with the highest rates were ‘Communications’, with an annual inflation rate of 10.8% compared to 0.9% last quarter, and ‘Housing’, with a rate of 6.9% compared to 4.5% last quarter. These rates reflect the impact of the increases to the telephone and water tariffs, introduced by Sure and Connect respectively.
‘Household energy’ remains the expenditure category with the lowest annual inflation rate, at 1.4%. This is mainly due to the price for domestic electricity, which accounts for over 85% of the category but whose price has not changed since 2016. The annual inflation rate of food was 2.8%, which means that the average price of food has increased compared to a year ago, but at a slightly lower annual rate than last quarter. This is the result of a combination of factors, including the reduction in import duty from 20% to 5% for all fruit and vegetables without added salt or sugar and the slight fall in the value of the Rand compared to a year ago (which makes imported goods cheaper), offsetting some of the increase in prices caused by changes to freight rates and price inflation in South Africa and the UK.
What is price inflation?
Price inflation is the change in the average prices of goods and services over time. The rate of price inflation is calculated from the change in the Retail Price Index (RPI), which is the official measure of the average change in the prices of goods and services paid by consumers. The RPI is estimated each quarter, or once every three months, and the rate of price inflation is usually quoted on an annual basis; that is, comparing price changes over a twelve month period. Prices and the RPI tend to go up, but they can occasionally go down – which is price deflation.
Why do we measure inflation?
An accurate measure of price inflation helps understand the extent and nature of the impact of price changes on the government, businesses, households and individuals.
How is the RPI calculated?
The basis for the RPI is the average weekly cost of goods and services purchased by households on St Helena, sometimes called the ‘shopping basket’. Items which households purchase more of, such as food, have the biggest share of the RPI basket. The current RPI uses a basket from the latest Household Expenditure Survey in 2017; prices of the items in the basket are collected every quarter, and the price of the total basket is compared to the price in the baseline period, the first quarter of 2018. By convention, the value of the basket in the baseline period is scaled to 100, and the RPI values are quoted in relation to that baseline. For example, an RPI value of 120 means that average prices have increased by 20 per cent compared to those recorded in the baseline period.
What happens when items are not available?
If an item of the ‘basket’ is not available then either the previous price will be carried forward from the previous quarter, or a suitable substitute item will be identified and an adjustment calculation made. Care is taken to ensure that this substitute item represents the item category and that it does not introduce error to the measurement of the RPI. An important principle is that price changes should reflect actual price increases, and not changes in the quality of items.