26 March 2018
About this Bulletin
The third Statistical Bulletin of 2018 provides new monthly estimates of the number of arrivals and departures to and from St Helena, with a focus on the period since the start of scheduled air operations in October 2017. All arrivals by air and sea are included, except very short-term day visitors arriving on cruise ships. The data released in this Bulletin is available here. A PDF version of this Bulletin is available here.
Total Arrivals and Departures
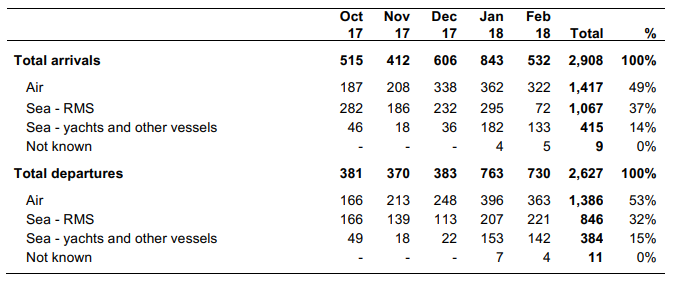
During the five-month period between October 2017 and February 2018, there were very high numbers of total arrivals – 2,908, more than a thousand higher than in the same period in 2016/17. The peak month was January, with 843 arrivals in total. Total departures were also high, but slightly lower than arrivals – 2,627. Most passengers arrived by air, some 1,417 – this is 50 arrivals higher than the number arriving by sea, on the RMS St Helena, during the same period in the previous year (1,367), or an average of 10 arrivals more per month.
Chart 1: Arrivals per month, by air and RMS St Helena, 2015-18
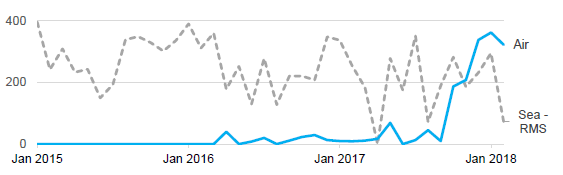
The period covered represents the historical peak season for arrivals to St Helena, when many Saint Helenians visit family and friends for Christmas and when weather conditions are favourable. Trends during these months may not be indicative of trends for the remaining seven months of the year. Additionally, during this five-month period, both the newly scheduled weekly Airlink air service to Johannesburg and the three-weekly RMS St Helena shipping service to Cape Town were operational. This almost doubled the total passenger arrival capacity compared to either the shipping or air service alone.
Table 1: Total arrivals and departures, by mode of transport
Purpose of Visit
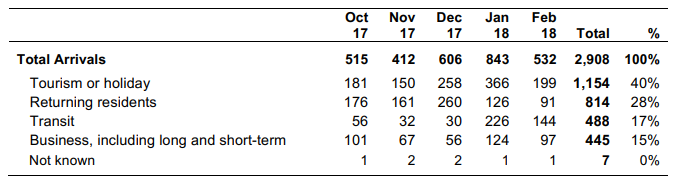
Most arrivals – some 40% – came to St Helena for tourism or a holiday; this may include relatively small numbers of Saint Helenians who live abroad but who visit for short periods, for example to visit family and friends, but who were not classed as ‘returning residents’. Returning residents were 28% of the total, and those arriving for business, which includes government personnel recruited overseas, and their families, were 15%. Transit passengers were 17% and mostly arrived by yacht.
Table 2: Purpose of arrivals
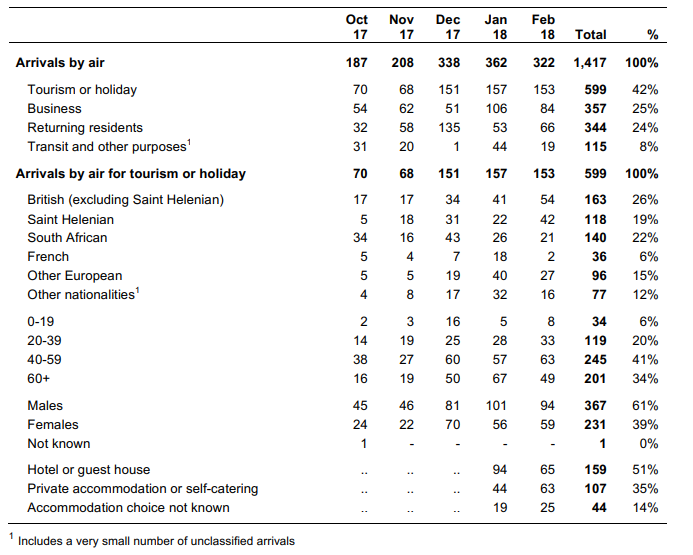
Arrivals by Air
Of those arriving by air, 42% were tourists, 25% arrived for business, and 24% were returning residents; the remaining number were transit passengers, including crew for merchant shipping. Arrivals of returning residents by air were highest in December (135), in time for Christmas. Since there is keen interest in developing the tourism industry, a number of additional indicators have been calculated for tourists arriving by air. Some points include:
- In December, January, and February there were around 150 tourists or holiday makers per month, around twice as many as October and November
- Around a quarter were British, with 22% South African, 19% St Helenian, 6% French, and 15% from elsewhere in Europe
- Most were in their forties and fifties (41%), with a further third sixty and over. Very few recorded tourists were under twenty (6%)
- 61% of tourists were male, almost twice as many males as females in some months
- At least half of all tourists stayed in hotels or guest houses in January and February (please note that data on accommodation was not captured prior to 2018)
Table 3: Arrivals by air
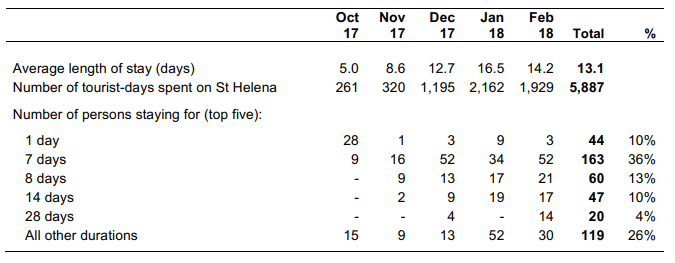
Length of Stay
The average length of stay for tourists both arriving and departing by air was around 13 days. A stay of seven or eight days – from one Saturday flight to the next (or the Sunday, if the outbound flight follows the Ascension shuttle) is the most common option, for 49% of tourists. Although 10% of tourists stayed only one day, this is heavily biased by the very first flight in October which included several persons staying only overnight.
Length of stay has been calculated for those persons arriving for tourism and arriving and departing by air by the end of February 2018. These are preliminary estimates; note that any tourists that did not depart by the end of February have been excluded from the calculations.
Table 4: Length of stay of tourists arriving and departing by air, by month of departure
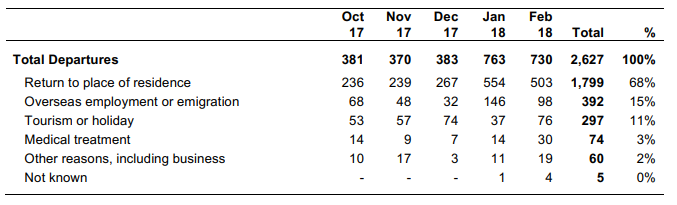
Departures
Most departures – 68% – were tourists and visitors returning to their place of residence, including St Helenians living overseas. 15% were people either leaving for employment opportunities or to settle elsewhere, and 11% were residents who were taking a holiday overseas.
Table 5: Departures from St Helena